Short
SHOP- rectangle pattern - short
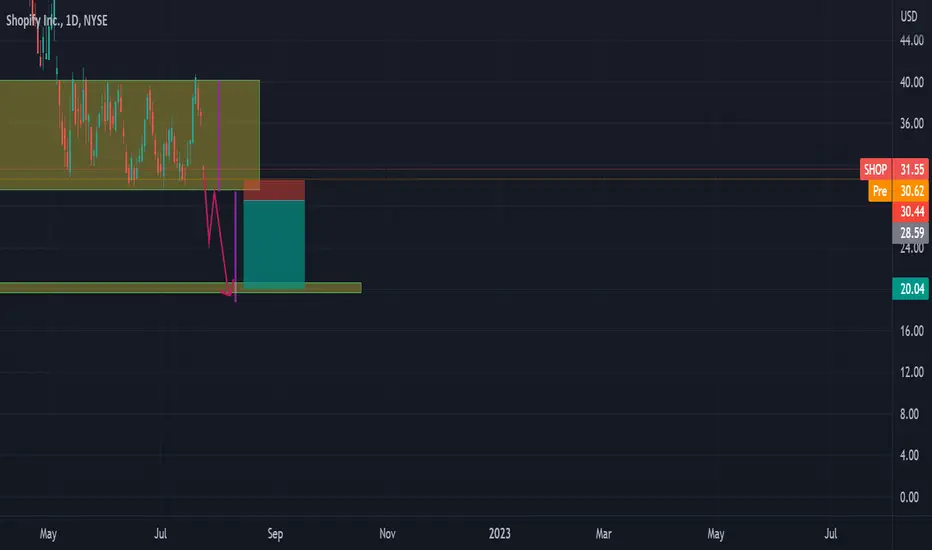
Shopify stock is in the range . It looks like the price is creating a rectangle pattern which may break to the downside.
Enter the trade if the price breaks below the rectangle and it retests the bottom of the rectangle as a resistance .
Target and the stop loss are shown in the chart.
Enter the trade if the price breaks below the rectangle and it retests the bottom of the rectangle as a resistance .
Target and the stop loss are shown in the chart.
💥 Free signals and ideas ➡ t.me/vfinvestment
Disclaimer
The information and publications are not meant to be, and do not constitute, financial, investment, trading, or other types of advice or recommendations supplied or endorsed by TradingView. Read more in the Terms of Use.
💥 Free signals and ideas ➡ t.me/vfinvestment
Disclaimer
The information and publications are not meant to be, and do not constitute, financial, investment, trading, or other types of advice or recommendations supplied or endorsed by TradingView. Read more in the Terms of Use.