🎯 SIL1!: Bulls Reclaim Control at Volume Node - Bears Exhausted
The Market Participant Battle:
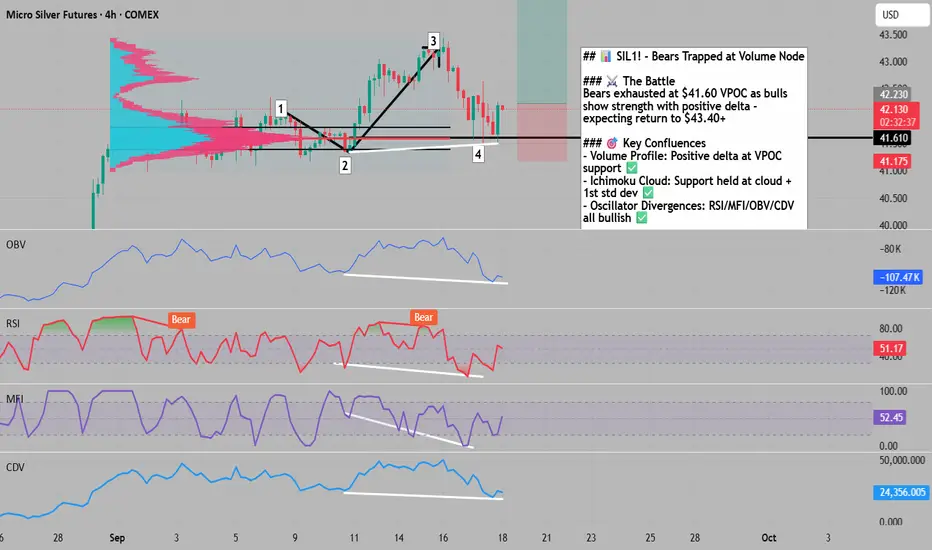
Bears who pushed silver from $43.40 (point 3) down to $41.61 (point 4) have been decisively beaten by bulls at a critical volume-weighted average price (VWAP) node. The exhaustion is evident through positive delta divergence and the first higher close in this entire decline sequence at point 2's turning zone. With RSI, MFI, OBV, and CDV all printing bullish divergences while price made a higher low, this setup suggests a powerful return move back toward the $43+ highs as trapped bears cover and new bulls enter at proven support.
Confluences:
Confluence 1: Volume Profile & Delta Divergence
The 4-hour volume footprint chart reveals critical market mechanics. At point 4, price returned precisely to the high-volume node (VPOC) where proven sellers from point 2 were expected. However, instead of continuation selling, we see positive delta prints and bullish imbalances on the recovery bar - the first time price closed higher than the previous bar during the entire 3-4 swing. This represents institutional accumulation at a key liquidity zone where bears expected continuation but found exhaustion.
Confluence 2: Ichimoku Cloud & Standard Deviation Return
The daily chart shows price returning to the first standard deviation from a significant origin point (the consolidation before the push to 3). The Ichimoku cloud structure remains bullish with price finding support at the cloud boundary. This mathematical mean reversion at a statistically significant level, combined with cloud support, creates a high-probability reversal zone that institutional algorithms recognize.
Confluence 3: Multiple Oscillator Divergences
The 4-hour chart displays clear bullish divergences across RSI, MFI, OBV, and CDV indicators. While price made a higher low at point 4 compared to point 2, all four oscillators printed lower lows. RSI shows oversold conditions with a "Bear" label, yet price structure suggests bear exhaustion. This quadruple divergence pattern historically precedes significant reversals in silver futures.
Web Research Findings:
- Technical Analysis: Silver futures show "strong buy" rating across multiple timeframes , with current consolidation around $43.30 after testing record highs
- Recent News/Earnings: Gold and silver futures retreated from record highs due to profit booking ahead of the Fed decision
- Analyst Sentiment: ING Think predicted silver would hover around $31, while UBS outlined a more bullish near-term target of $38-$40
- Data Releases & Economic Calendar: Fed cut rates by 25 basis points to 4-4.25% on September 17, the first cut since December 2024
- Interest Rate Impact: Markets betting on additional cuts in October and December with over 70% probability
Layman's Summary:
Silver just got a boost from the Fed's first rate cut of the year, making it cheaper to hold precious metals. The metal pulled back from near-record highs around $43 as traders took profits, but found strong support at $41.60 where big buyers stepped in. Technical indicators are flashing "oversold" just as the Fed signals more cuts coming - historically a powerful combination for silver rallies. With industrial demand from solar panels and EVs remaining strong, this temporary pullback looks like bears running out of steam rather than a trend change.
Machine Derived Information:
- Image 1: 4-hour volume footprint showing positive delta at VPOC support - Significance: Institutional accumulation visible at key level - AGREES ✔
- Image 2: Daily Ichimoku cloud with numbered swing points - Significance: Price respecting cloud support and mean reversion levels - AGREES ✔
- Image 3: 4-hour oscillator divergences across multiple indicators - Significance: Quadruple bullish divergence pattern confirming reversal - AGREES ✔
Actionable Machine Summary:
All three charts align perfectly: volume analysis shows buyers defeating sellers at a critical node, cloud structure confirms support holds, and oscillators scream oversold with divergences. The setup triggers when price reclaims $42.20 with volume, targeting $43.40 initially and $44+ on continuation. Risk is clearly defined below $41.50 where the thesis fails.
Conclusion:
Trade Prediction: SUCCESS
Confidence: High
The confluence of volume-based accumulation, mathematical mean reversion, oscillator divergences, and fundamental tailwinds from Fed easing creates a high-probability reversal setup. Bears who pressed their luck from $43.40 are now trapped as support held exactly where it should. With the Fed just beginning its easing cycle and industrial demand remaining robust, this pullback represents a gift for bulls who missed the initial rally. Risk/reward favors longs with 3:1 potential targeting the recent highs.
The Market Participant Battle:
Bears who pushed silver from $43.40 (point 3) down to $41.61 (point 4) have been decisively beaten by bulls at a critical volume-weighted average price (VWAP) node. The exhaustion is evident through positive delta divergence and the first higher close in this entire decline sequence at point 2's turning zone. With RSI, MFI, OBV, and CDV all printing bullish divergences while price made a higher low, this setup suggests a powerful return move back toward the $43+ highs as trapped bears cover and new bulls enter at proven support.
Confluences:
Confluence 1: Volume Profile & Delta Divergence
The 4-hour volume footprint chart reveals critical market mechanics. At point 4, price returned precisely to the high-volume node (VPOC) where proven sellers from point 2 were expected. However, instead of continuation selling, we see positive delta prints and bullish imbalances on the recovery bar - the first time price closed higher than the previous bar during the entire 3-4 swing. This represents institutional accumulation at a key liquidity zone where bears expected continuation but found exhaustion.
Confluence 2: Ichimoku Cloud & Standard Deviation Return
The daily chart shows price returning to the first standard deviation from a significant origin point (the consolidation before the push to 3). The Ichimoku cloud structure remains bullish with price finding support at the cloud boundary. This mathematical mean reversion at a statistically significant level, combined with cloud support, creates a high-probability reversal zone that institutional algorithms recognize.
Confluence 3: Multiple Oscillator Divergences
The 4-hour chart displays clear bullish divergences across RSI, MFI, OBV, and CDV indicators. While price made a higher low at point 4 compared to point 2, all four oscillators printed lower lows. RSI shows oversold conditions with a "Bear" label, yet price structure suggests bear exhaustion. This quadruple divergence pattern historically precedes significant reversals in silver futures.
Web Research Findings:
- Technical Analysis: Silver futures show "strong buy" rating across multiple timeframes , with current consolidation around $43.30 after testing record highs
- Recent News/Earnings: Gold and silver futures retreated from record highs due to profit booking ahead of the Fed decision
- Analyst Sentiment: ING Think predicted silver would hover around $31, while UBS outlined a more bullish near-term target of $38-$40
- Data Releases & Economic Calendar: Fed cut rates by 25 basis points to 4-4.25% on September 17, the first cut since December 2024
- Interest Rate Impact: Markets betting on additional cuts in October and December with over 70% probability
Layman's Summary:
Silver just got a boost from the Fed's first rate cut of the year, making it cheaper to hold precious metals. The metal pulled back from near-record highs around $43 as traders took profits, but found strong support at $41.60 where big buyers stepped in. Technical indicators are flashing "oversold" just as the Fed signals more cuts coming - historically a powerful combination for silver rallies. With industrial demand from solar panels and EVs remaining strong, this temporary pullback looks like bears running out of steam rather than a trend change.
Machine Derived Information:
- Image 1: 4-hour volume footprint showing positive delta at VPOC support - Significance: Institutional accumulation visible at key level - AGREES ✔
- Image 2: Daily Ichimoku cloud with numbered swing points - Significance: Price respecting cloud support and mean reversion levels - AGREES ✔
- Image 3: 4-hour oscillator divergences across multiple indicators - Significance: Quadruple bullish divergence pattern confirming reversal - AGREES ✔
Actionable Machine Summary:
All three charts align perfectly: volume analysis shows buyers defeating sellers at a critical node, cloud structure confirms support holds, and oscillators scream oversold with divergences. The setup triggers when price reclaims $42.20 with volume, targeting $43.40 initially and $44+ on continuation. Risk is clearly defined below $41.50 where the thesis fails.
Conclusion:
Trade Prediction: SUCCESS
Confidence: High
The confluence of volume-based accumulation, mathematical mean reversion, oscillator divergences, and fundamental tailwinds from Fed easing creates a high-probability reversal setup. Bears who pressed their luck from $43.40 are now trapped as support held exactly where it should. With the Fed just beginning its easing cycle and industrial demand remaining robust, this pullback represents a gift for bulls who missed the initial rally. Risk/reward favors longs with 3:1 potential targeting the recent highs.
for trading mentorship and community, message me on telegram : jacesabr_real
Disclaimer
The information and publications are not meant to be, and do not constitute, financial, investment, trading, or other types of advice or recommendations supplied or endorsed by TradingView. Read more in the Terms of Use.