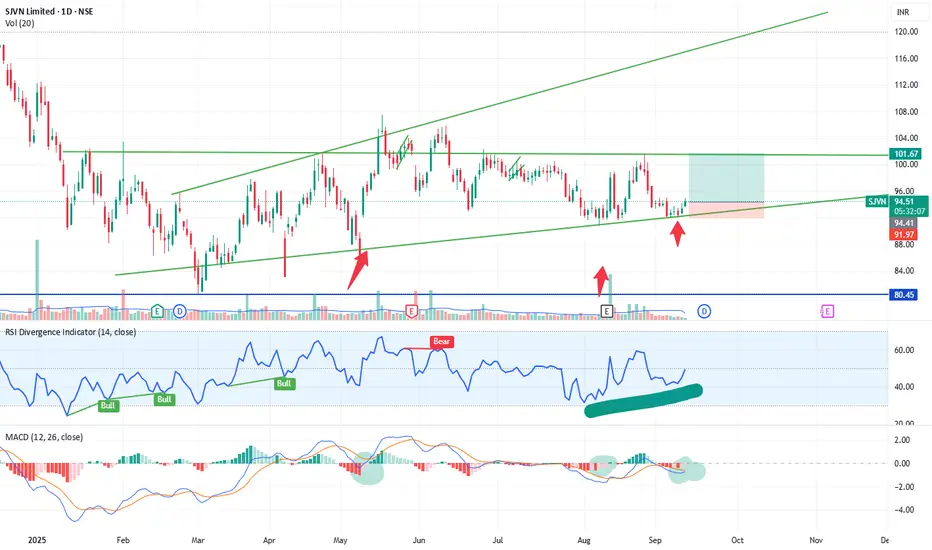
SJVN Ltd. is showing signs of a potential bullish reversal after taking support at the lower boundary of an ascending channel. The stock has formed a consistent pattern of higher lows and is currently trading at ₹94.55 with increasing volume and positive momentum on key indicators.
✅ Key Technical Highlights:
📈 Chart Pattern:
Trading within a well-defined ascending channel.
Recently bounced off the channel support line (third touch confirmation).
Next resistance zone lies near ₹101.67, which aligns with the upper trendline and horizontal supply zone.
📊 Indicators:
RSI Divergence: Bullish divergence seen — RSI made a higher low while price made a lower low, signaling potential reversal.
MACD Bullish Crossover: MACD line has crossed above the signal line near oversold levels — historically a strong bullish sign.
Volume: Notable volume spike observed at support — indicating accumulation.
📏 Risk-Reward Zone (For Study Purposes Only):
Entry Zone: ₹93–₹95
Target: ₹101–₹102
Stop Loss: Below ₹91.97
⚠️ Note:
This post is purely for educational and analysis purposes only. It is not a recommendation to buy or sell any security. Always do your own research or consult a qualified advisor before making investment decisions.
Disclaimer
The information and publications are not meant to be, and do not constitute, financial, investment, trading, or other types of advice or recommendations supplied or endorsed by TradingView. Read more in the Terms of Use.
Disclaimer
The information and publications are not meant to be, and do not constitute, financial, investment, trading, or other types of advice or recommendations supplied or endorsed by TradingView. Read more in the Terms of Use.