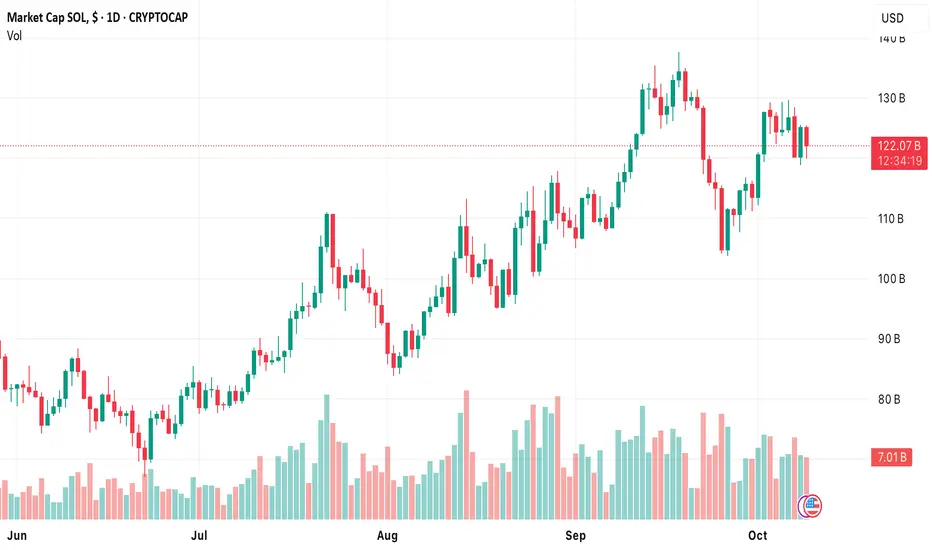
The SOL/USD pair continues to trade within a long-term upward channel, but since the start of October, momentum has slowed, pushing price action into a sideways range between 234.38 and 218.75 (Murray [7/8]–[6/8]). The market has failed to break out of this corridor so far.
A break above 234.38 would confirm bullish continuation toward 250.00, 265.62 (Murray [+1/8], upper channel boundary), and 281.25 (Murray [+2/8]). Conversely, a drop below 218.75 — the midline of the Bollinger Bands — could trigger a deeper pullback to 183.80 (50% Fibonacci retracement) and potentially push SOL out of its current range.
⸻
Technical View
Indicators remain mixed:
• Bollinger Bands are flat, reflecting consolidation.
• The MACD histogram has turned positive, signaling fading bearish pressure.
• Stochastic is turning lower from the overbought zone, hinting at short-term cooling.
On the weekly chart, however, the broader bullish trend remains intact, confirming that Solana is still positioned within its long-term uptrend channel.
⸻
Support and Resistance Levels
• Resistance: 234.38, 250.00, 265.62, 281.25
• Support: 218.75, 183.80
⸻
Trading Scenarios
Bullish Scenario:
Long positions may be considered above 234.38, with targets at 250.00, 265.62, and 281.25, and a stop-loss at 223.00.
Implementation horizon: 5–7 days.
Bearish Scenario:
Short positions could be opened below 218.75, with a target at 183.80 and a stop-loss at 237.00.
⸻
Outlook:
Solana remains in a consolidation phase within its ascending structure. A breakout above 234.38 could signal the start of a new bullish impulse, while failure to hold 218.75 would open the door for a deeper retracement toward 183.80.
Disclaimer
The information and publications are not meant to be, and do not constitute, financial, investment, trading, or other types of advice or recommendations supplied or endorsed by TradingView. Read more in the Terms of Use.
Disclaimer
The information and publications are not meant to be, and do not constitute, financial, investment, trading, or other types of advice or recommendations supplied or endorsed by TradingView. Read more in the Terms of Use.