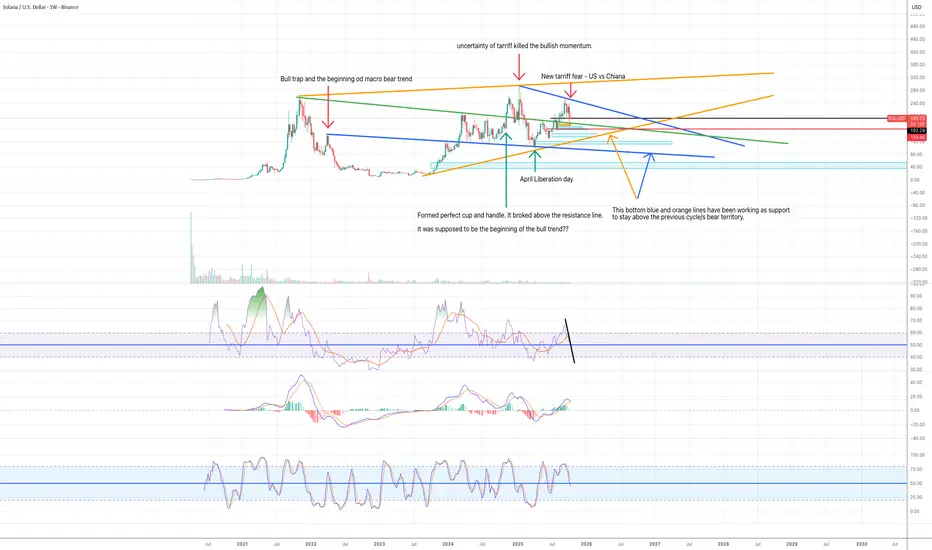
I can see a few patterns in a weekly chart.
1) The price is moving inside the blue descending wedge pattern.
2) The price is moving inside the orange ascending wedge pattern.
3) Green descending support/resistance line is the line that completes a huge cup and handle pattern.
What do you think? I would like to know what others see.
Have a nice weekend.
Related publications
Disclaimer
The information and publications are not meant to be, and do not constitute, financial, investment, trading, or other types of advice or recommendations supplied or endorsed by TradingView. Read more in the Terms of Use.
Related publications
Disclaimer
The information and publications are not meant to be, and do not constitute, financial, investment, trading, or other types of advice or recommendations supplied or endorsed by TradingView. Read more in the Terms of Use.