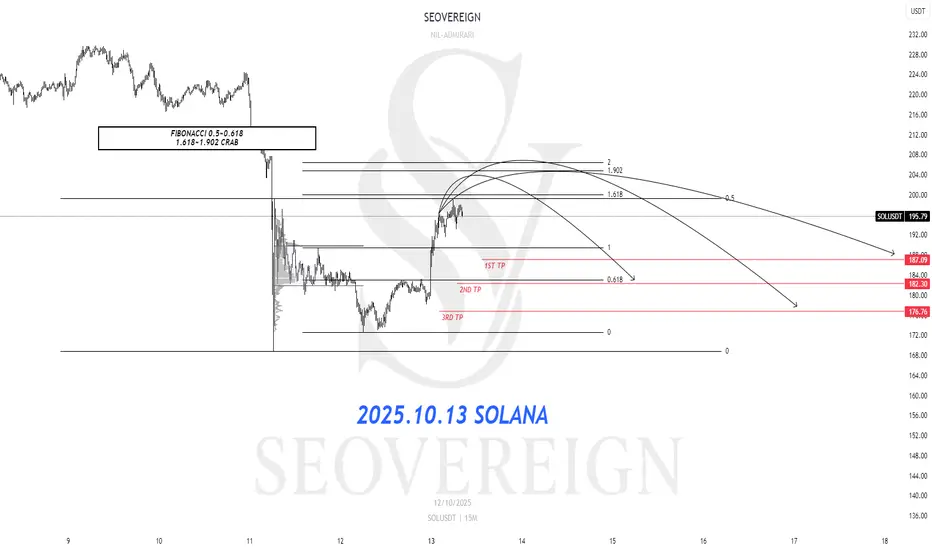
Today, I would like to share my bearish outlook on Solana as of October 13.
The first basis for this view lies in the 0.5–0.618 Fibonacci retracement zone.
This zone is known as a key area where, after a correction within an uptrend has completed, short-term rebounds tend to be limited and a bearish reversal often follows.
In particular, the 0.618 level—often referred to as the “golden retracement ratio”—typically serves as a strong resistance point where selling pressure re-emerges after an excessive pullback.
Currently, Solana’s upward momentum appears to be slowing within this 0.5–0.618 range, suggesting that the upper resistance pressure is gradually intensifying.
The second basis is the 1.618–1.902 CRAB pattern.
While the Potential Reversal Zone (PRZ) of a traditional Crab pattern is located at the 1.618 extension of the XA leg, it is often observed in real market conditions that prices extend up to the 1.902 level before a sharp reversal occurs.
This range indicates that the market has entered an overheated phase, and strong corrective waves frequently emerge when the pattern completes.
Accordingly, the average target price is set around 182 USDT.
Depending on how the chart unfolds,
I will provide further updates to this idea, including position management and any significant changes.
Thank you for reading.
🔴유튜브
🔗youtube.com/@seovereign
🌐서버린 공식 텔레그램 토론방
🔗t.me/+Sd_TSg2IX3k4Njg1
📌FIFTH(전자책) 무료 배포-분석법 공개
🔗tinyurl.com/FIFTH-SAMPLE
⚠️경고: 무근의 명예훼손·욕설·비방은 형사·민사 대응합니다. 계정추적·고소·손배 청구를 진행할 수 있으며, 모든 관련 자료(스크린샷·로그)를 수집하고 있습니다.
🔗youtube.com/@seovereign
🌐서버린 공식 텔레그램 토론방
🔗t.me/+Sd_TSg2IX3k4Njg1
📌FIFTH(전자책) 무료 배포-분석법 공개
🔗tinyurl.com/FIFTH-SAMPLE
⚠️경고: 무근의 명예훼손·욕설·비방은 형사·민사 대응합니다. 계정추적·고소·손배 청구를 진행할 수 있으며, 모든 관련 자료(스크린샷·로그)를 수집하고 있습니다.
Disclaimer
The information and publications are not meant to be, and do not constitute, financial, investment, trading, or other types of advice or recommendations supplied or endorsed by TradingView. Read more in the Terms of Use.