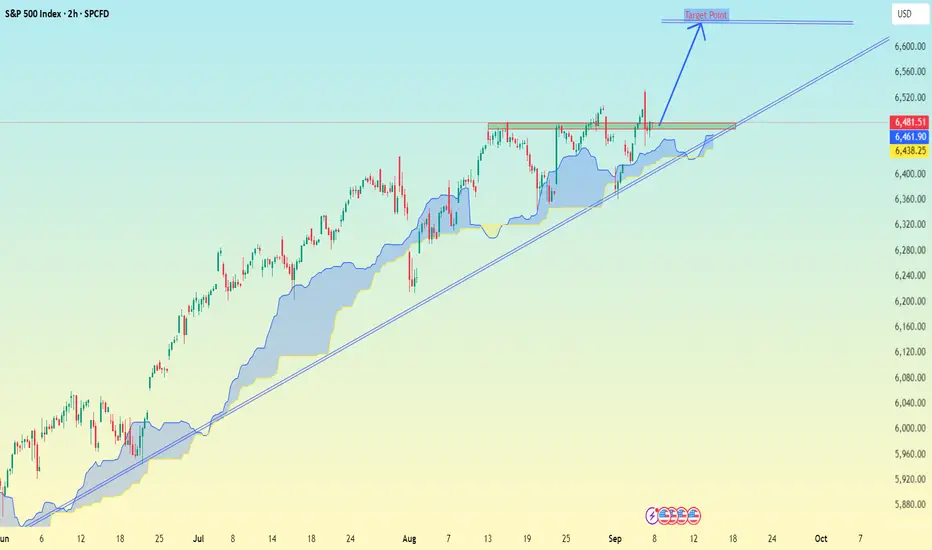
This is a 2h timeframe (SPCFD index, looks like US500 / S&P CFD).
Current price is around 6,403.
I have drawn a falling trendline from July, and price is now near the lower zone.
There’s also volume profile (VPVR) on the right side, showing key liquidity zones.
A target point is marked below, around the 6,200 level.
📌 Target Zone:
My chart suggests a downside target around 6,200 (highlighted with the blue arrow).
⚠ Notes:
If 6,400 support breaks clearly, sellers may push toward 6,300 → 6,200.
But if price reclaims above 6,480–6,500, the short-term bearish setup could fail, and we may see a bounce.
👉 Immediate target: 6,200
👉 Stop-loss to watch (invalidating short): above 6,500
📲 Join telegram channel free .
t.me/addlist/dg3uSwzkMSplNjFk
Forex, Gold & Crypto Signals with detailed analysis & get consistent results.
t.me/addlist/dg3uSwzkMSplNjFk
Gold Signal's with proper TP & SL for high profit opportunities.
t.me/addlist/dg3uSwzkMSplNjFk
Forex, Gold & Crypto Signals with detailed analysis & get consistent results.
t.me/addlist/dg3uSwzkMSplNjFk
Gold Signal's with proper TP & SL for high profit opportunities.
Related publications
Disclaimer
The information and publications are not meant to be, and do not constitute, financial, investment, trading, or other types of advice or recommendations supplied or endorsed by TradingView. Read more in the Terms of Use.