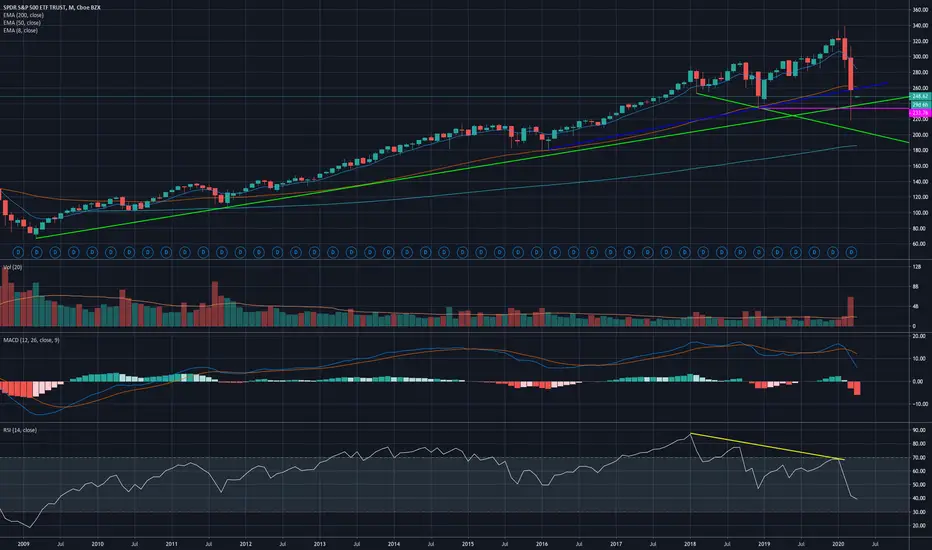
In this analysis, I’m looking at the monthly chart since 2009 to get some perspective - I've been too focused on the past month, but it's important to get a high-level perspective.
The next big support zone is the confluence of the long-term trendline (since 2019, represented in green) and Dec 2018 lows (purple horizontal line) between $236 and $233. The previous support line (in blue) since 2016 is now acting as resistance, and we’re well below EMA 200 and EMA 50.
If $233/$236 won’t hold, which given the economic reality is a strong possibility, we will test $200, which a lot of people seem to agree could be a more believable bottom for this. I'm not trying to predict the bottom, just trying to understand the damage on the economy, so I can better assess price-to-earnings on some stocks.
Governments across Europe are delaying their hopes of re-opening countries and the economy since numbers are still growing strongly. We were sold the idea of a quick recovery, but we're now realizing the extent of the damage the virus is capable of, both in our health and in the economy.
Stay safe out there, and good luck with your trades!
Related publications
Disclaimer
The information and publications are not meant to be, and do not constitute, financial, investment, trading, or other types of advice or recommendations supplied or endorsed by TradingView. Read more in the Terms of Use.
Related publications
Disclaimer
The information and publications are not meant to be, and do not constitute, financial, investment, trading, or other types of advice or recommendations supplied or endorsed by TradingView. Read more in the Terms of Use.