🔎 Overview
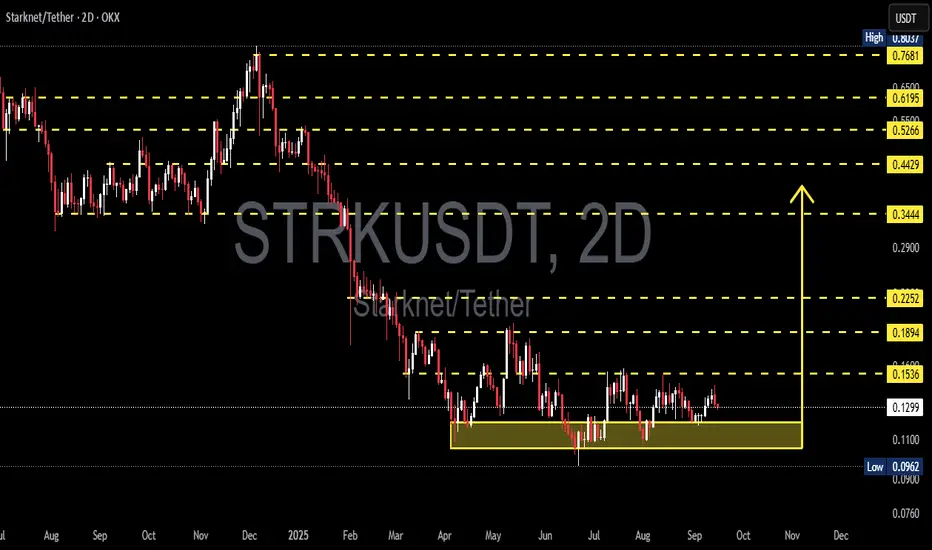
The STRK/USDT (2D) chart is showing a consolidation phase after a heavy downtrend since early 2025. Price is currently trading around 0.1299, hovering just above a key support zone at 0.096–0.11 (yellow box) which has been tested multiple times and continues to hold.
This structure resembles a rectangle accumulation pattern, often seen when buyers quietly build positions after a long selloff. If this base holds, it could mark the foundation for a mid-term reversal. If it fails, however, the broader downtrend is likely to continue.
---
📊 Key Technical Levels
Major Support:
0.1100 → upper bound of accumulation zone
0.0962 → critical low (must hold)
Key Resistances:
R1 = 0.1536 (immediate breakout trigger)
R2 = 0.1894
R3 = 0.2252
R4 = 0.3444 (potential swing target if reversal is confirmed)
---
🟢 Bullish Scenario
1. Breakout of 0.1536:
A strong 2D close above 0.1536, ideally backed by volume, would signal a bullish reversal. First target sits at 0.1894, followed by 0.2252.
2. Accumulation at Support (0.096–0.11):
Gradual accumulation near this zone offers favorable risk/reward for mid-term traders. Stop-loss should be placed just below 0.0962. If successful, upside targets range from +45% to over +150% depending on how far momentum extends.
3. Bullish Confirmation Signals:
RSI/MACD bullish divergence
Rising volume on breakout
Bullish reversal candlestick patterns at support
---
🔴 Bearish Scenario
1. Breakdown Below 0.11:
A decisive close below 0.11 — and especially below 0.0962 — would invalidate the bullish accumulation setup. This would expose STRK to further downside, potentially targeting the 0.076 zone (previous structural low).
2. False Breakout Risk:
Traders should be cautious of bull traps — where price breaks above 0.1536 but quickly falls back into the range. Such moves often occur in weak markets.
---
📐 Pattern & Market Sentiment
Pattern: Rectangle Accumulation at bottom trend
Sentiment: Neutral → turning bullish if breakout above 0.1536 is confirmed
Key Triggers:
Bullish trigger → 0.1536
Bearish trigger → 0.0962
---
⚠️ Notes
Always wait for volume confirmation on breakouts/breakdowns.
Use strict risk management and place stop-losses below/above structural levels.
Watch Bitcoin’s trend as overall market sentiment often drives altcoins.
---
🎯 Conclusion
STRK is currently sitting at a make-or-break zone. This could either be the start of a strong mid-term reversal or just a pause before further decline.
Bullish path: Break & hold above 0.1536 → targets at 0.1894 – 0.2252.
Bearish path: Break below 0.11 → retest of 0.0962 and possibly down to 0.076.
Patience and confirmation will be key.
---
#STRK #STRKUSDT #Starknet #CryptoAnalysis #CryptoTrading #PriceAction #Breakout #Accumulation #SupportResistance
✅ Get Free Signals! Join Our Telegram Channel Here: t.me/TheCryptoNuclear
✅ Twitter: twitter.com/crypto_nuclear
✅ Join Bybit : partner.bybit.com/b/nuclearvip
✅ Benefits : Lifetime Trading Fee Discount -50%
✅ Twitter: twitter.com/crypto_nuclear
✅ Join Bybit : partner.bybit.com/b/nuclearvip
✅ Benefits : Lifetime Trading Fee Discount -50%
Disclaimer
The information and publications are not meant to be, and do not constitute, financial, investment, trading, or other types of advice or recommendations supplied or endorsed by TradingView. Read more in the Terms of Use.