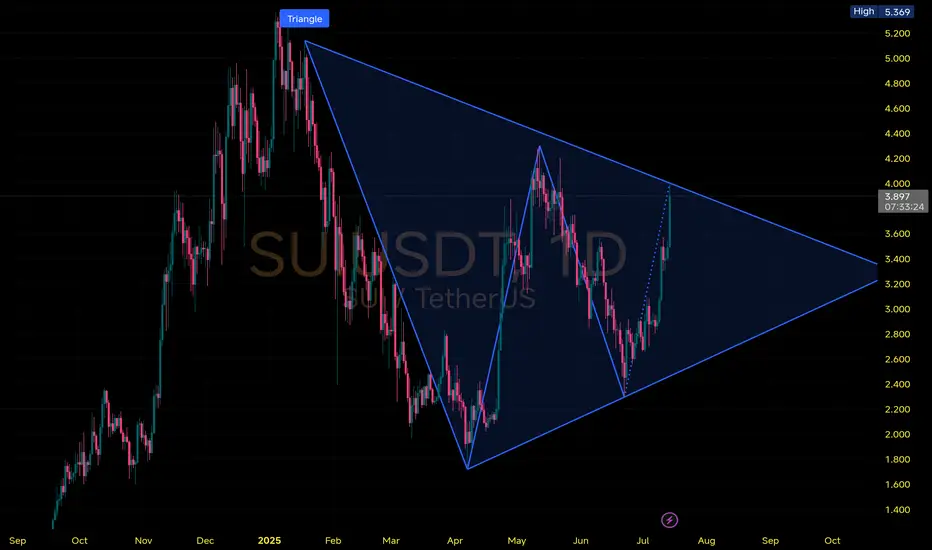
Price is tightening within a large symmetrical triangle pattern on the 1D chart, signaling a major move brewing in the coming weeks.
🔹Price currently pushing toward upper trendline resistance near $4.00
🔸Upside Potential: Break above $4.20 could trigger a rally toward $5.00–$5.30+
🔹Pattern target (if breakout confirmed): roughly $6.00+ based on pole height
🔸Support at $3.20 is key triangle base
🔹Breakdown below = bearish continuation risk toward $2.50
#SUI is coiling within a triangle. A breakout is imminent — watch closely for a decisive move above or below structure.
Disclaimer
The information and publications are not meant to be, and do not constitute, financial, investment, trading, or other types of advice or recommendations supplied or endorsed by TradingView. Read more in the Terms of Use.
Disclaimer
The information and publications are not meant to be, and do not constitute, financial, investment, trading, or other types of advice or recommendations supplied or endorsed by TradingView. Read more in the Terms of Use.