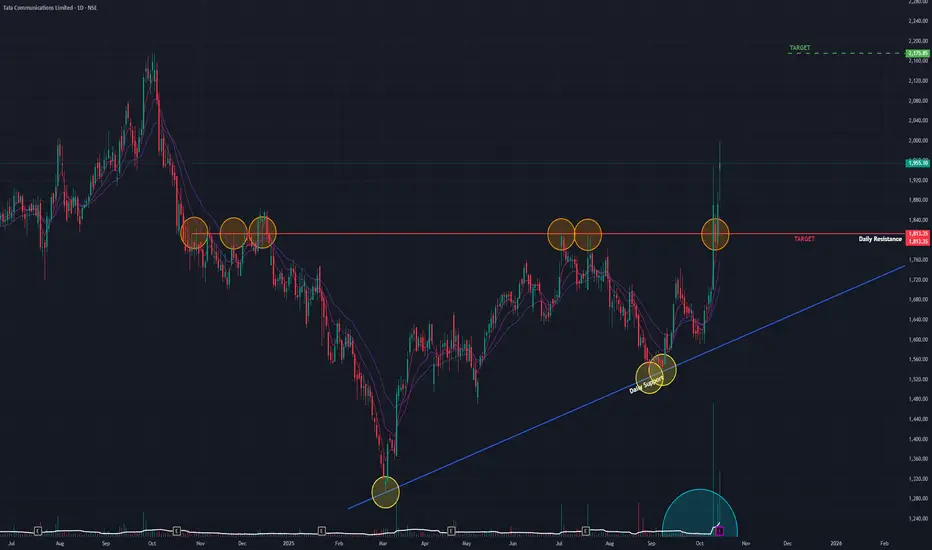
Tata Communications has completed all the phases of a classic bullish breakout, but today's trading action suggests a brief pause or indecision before a potential new leg up. The overall technical posture remains strong as long as the stock holds above its newly established support.
The Setup: An Ascending Triangle
Following a brief downtrend from its September 2024 All-Time High, the stock began forming a solid base. This took the shape of a classic Ascending Triangle, characterized by a series of Higher Lows pushing up against a flat horizontal resistance of Equal Highs. This is a powerful bullish pattern that indicates building pressure.
Last week, the stock successfully broke out of this pattern. More importantly, during the current week, it performed a successful retest of the breakout level, with the old resistance now acting as new support—a strong sign of a valid breakout.
Today's Indecisive Action
Today's session (Wednesday, October 15, 2025) started with strong bullish intent:
- The stock opened with a gap-up on good volume.
- However, by the end of the day, it formed a neutral candle (like a Doji or Spinning Top).
This indicates that despite the initial buying pressure, neither bulls nor bears could gain control, resulting in a stalemate for the session. This suggests a momentary pause or indecision.
Underlying Technical Strength
Despite today's pause, the broader technical picture remains firmly bullish. Key momentum indicators, including the short-term Exponential Moving Averages (EMAs) and the Relative Strength Index (RSI), are in a bullish state across the Monthly, Weekly, and Daily timeframes.
Outlook and Key Levels
With a confirmed breakout and retest, the path of least resistance has shifted upwards.
- Bullish Target: If the bullish momentum resumes after this brief pause, the next logical area of resistance and potential target is the ₹2,175 level.
- Critical Support: The breakout point, around ₹1,813, is now the most critical support level to watch. As long as the stock remains above this "line in the sand," the bullish outlook remains intact. A close below this level would negate the breakout.
In conclusion, while today's action signals a short-term pause, the overall technical evidence is bullish. The key is for the stock to hold the critical ₹1,813 support level before continuing its uptrend.
Disclaimer: This analysis is my personal view & for educational purposes only. They shall not be construed as trade or investment advice. Before making any financial decision, it is imperative that you consult with a qualified financial professional.
Disclaimer
The information and publications are not meant to be, and do not constitute, financial, investment, trading, or other types of advice or recommendations supplied or endorsed by TradingView. Read more in the Terms of Use.
