Tata Motors Ltd (TATAMOTORS) as of May 10th, 2025.
Here's a technical analysis:
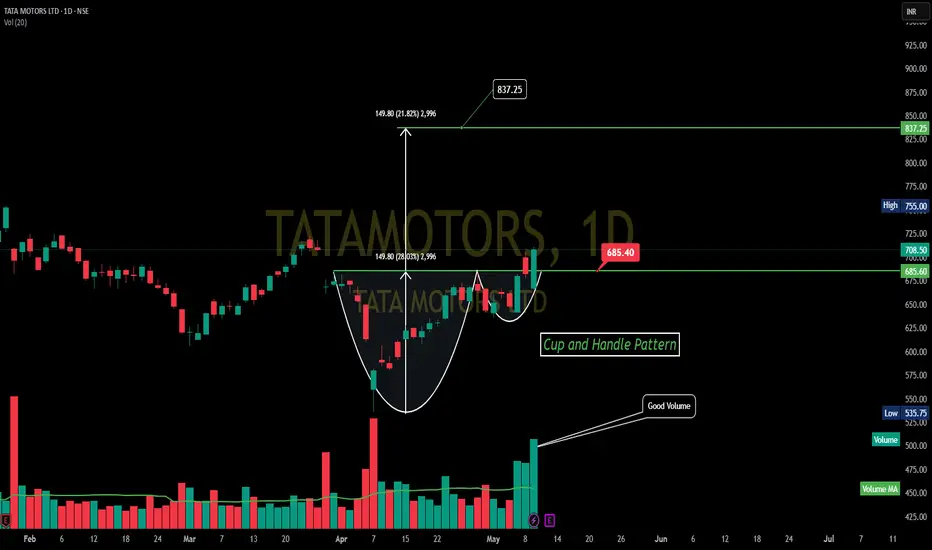
Prior Downtrend: The stock was in a downtrend from approximately November 2024 until late March/early April 2025, with the low around 535.75.
Cup and Handle Pattern: A "Cup and Handle" pattern is clearly identified on the chart. This is typically a bullish reversal or continuation pattern.
Cup: Formed from roughly early April 2025 to early May 2025. The bottom of the cup is around the 535.75 low.
Handle: A small, slightly downward-drifting consolidation (the handle) formed in early to mid-May 2025.
Neckline/Breakout Level: The resistance level or neckline of this pattern is around 685.40. The price has broken out above this neckline.
Volume:
The chart annotates "Good Volume" during the formation of the right side of the cup and especially on the breakout from the handle. An increase in volume during a breakout is a positive sign and adds validity to the pattern.
Support and Resistance:
Immediate Support: The breakout level around 685.40 (the neckline) should now act as a key support level.
Major Support: The low of the cup around 535.75 is a more significant support level.
Resistance/Target: The chart indicates a potential target of 837.25. This target is calculated by adding the depth of the cup (approximately 149.80 points) to the breakout level of the neckline.
Recent High: The chart also shows a "High" marked at 886.75, which seems to be a much earlier high (likely before the period shown in detail for the cup and handle) and would act as a longer-term resistance if the price moves significantly beyond the pattern's target.
Interpretation:
The chart for Tata Motors suggests a bullish outlook following the breakout from the Cup and Handle pattern.
The "Good Volume" accompanying the breakout adds strength to this bullish signal.
The stock has successfully surpassed the neckline resistance at 685.40.
The primary target based on this pattern is 837.25.
It's important for the price to hold above the 685.40 support level to maintain the bullish momentum. A fall back below this level could weaken the immediate bullish outlook.
Disclaimer: This technical analysis is for educational purposes only and should not be considered as financial advice. Trading and investing in the stock market involve risks. Always conduct your own thorough research and consult with a qualified financial advisor before making any investment decisions.
Sources and related content
Here's a technical analysis:
Prior Downtrend: The stock was in a downtrend from approximately November 2024 until late March/early April 2025, with the low around 535.75.
Cup and Handle Pattern: A "Cup and Handle" pattern is clearly identified on the chart. This is typically a bullish reversal or continuation pattern.
Cup: Formed from roughly early April 2025 to early May 2025. The bottom of the cup is around the 535.75 low.
Handle: A small, slightly downward-drifting consolidation (the handle) formed in early to mid-May 2025.
Neckline/Breakout Level: The resistance level or neckline of this pattern is around 685.40. The price has broken out above this neckline.
Volume:
The chart annotates "Good Volume" during the formation of the right side of the cup and especially on the breakout from the handle. An increase in volume during a breakout is a positive sign and adds validity to the pattern.
Support and Resistance:
Immediate Support: The breakout level around 685.40 (the neckline) should now act as a key support level.
Major Support: The low of the cup around 535.75 is a more significant support level.
Resistance/Target: The chart indicates a potential target of 837.25. This target is calculated by adding the depth of the cup (approximately 149.80 points) to the breakout level of the neckline.
Recent High: The chart also shows a "High" marked at 886.75, which seems to be a much earlier high (likely before the period shown in detail for the cup and handle) and would act as a longer-term resistance if the price moves significantly beyond the pattern's target.
Interpretation:
The chart for Tata Motors suggests a bullish outlook following the breakout from the Cup and Handle pattern.
The "Good Volume" accompanying the breakout adds strength to this bullish signal.
The stock has successfully surpassed the neckline resistance at 685.40.
The primary target based on this pattern is 837.25.
It's important for the price to hold above the 685.40 support level to maintain the bullish momentum. A fall back below this level could weaken the immediate bullish outlook.
Disclaimer: This technical analysis is for educational purposes only and should not be considered as financial advice. Trading and investing in the stock market involve risks. Always conduct your own thorough research and consult with a qualified financial advisor before making any investment decisions.
Sources and related content
Disclaimer
The information and publications are not meant to be, and do not constitute, financial, investment, trading, or other types of advice or recommendations supplied or endorsed by TradingView. Read more in the Terms of Use.
Disclaimer
The information and publications are not meant to be, and do not constitute, financial, investment, trading, or other types of advice or recommendations supplied or endorsed by TradingView. Read more in the Terms of Use.