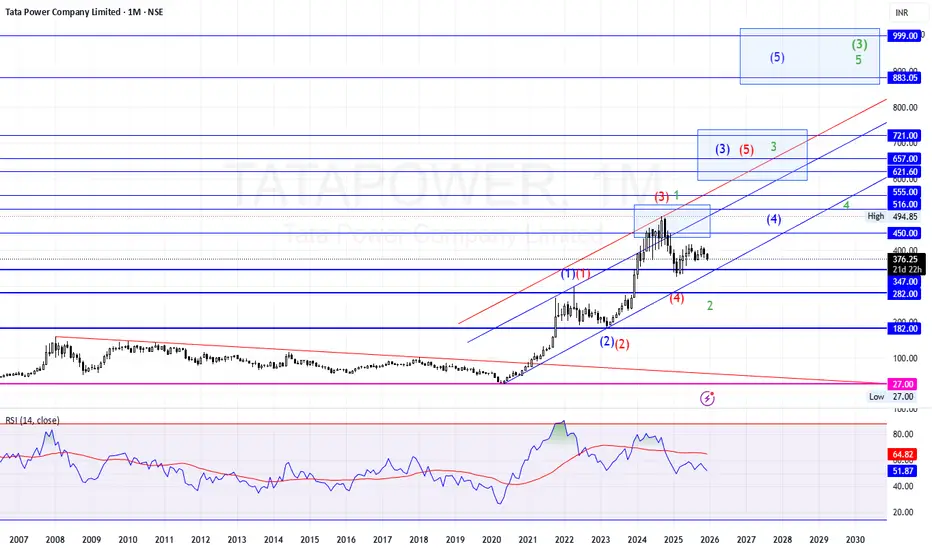
Price: ₹376 • Timeframe: 1M • Trend: Long-Term Bullish
Structure: Elliott Waves + Rising Channel + Fibonacci Targets
🔷 LONG-TERM STRUCTURAL VIEW
Tata Power has completed a 10+ year accumulation and broken into a long-term uptrend since 2020.
Price is respecting a strong rising channel, with multiple clean touches on both upper and lower boundaries.
The market is currently in a multi-year impulsive cycle, following a textbook Elliott Wave structure.
📌 ELLIOTT WAVE OVERVIEW
Primary Count
Wave (1): Breakout from long-term base
Wave (2): Pullback to channel support
Wave (3): Strong rally into 2023 highs
Wave (4): Current consolidation phase
Wave (5): Projected upward expansion (targets below)
Subwave Count
Clear subwave notations (1)-(2)-(3)-(4)-(5) seen inside the major impulsive structure.
Wave 4 is forming high-timeframe support between ₹347–₹450.
📌 SUPPORT ZONES
Level Importance
₹450 Immediate resistance turned support candidate
₹347 Major Wave (4) support zone
₹282 Strong structural support
₹182 High-timeframe base level
₹27 Legacy low (unlikely to be seen again)
As long as price stays above ₹347, Wave 5 remains intact.
📌 RESISTANCE & TARGET ZONES
Wave 3 Zone (Already Hit)
₹621 → ₹657 → ₹721
This was the previous high-volume rejection block.
Wave 5 Major Projection Zones
Primary Wave 5 Target
₹721 → ₹883 → ₹999
Extended Wave 5 Target
(If momentum accelerates)
₹1,050 → ₹1,250
(not shown on chart but possible on extended fib cycles)
The blue box around ₹883–₹999 is the strongest high-probability target zone for 2026–2028.
🔥 CHANNEL STRUCTURE
The price is moving inside a well-defined ascending channel:
Lower blue channel line = perfect support during Wave 2 & Wave 4
Midline acts as a reaction zone
Upper channel line projects Wave 5 targets around ₹883–₹999
Channel geometry strongly supports the Wave 5 upward leg.
🔵 RSI MOMENTUM (MONTHLY)
RSI is currently holding above 51
The previous overbought region (Wave 3) is cooling off naturally
No bearish divergence on the larger trend
Trend continuation remains possible once RSI curls upward again
This RSI structure is typical of Wave 4 consolidation before the final impulse.
🚀 PRICE OUTLOOK (2025–2028)
Short-Term (3–6 Months)
Range: ₹347 → ₹450
A breakout above ₹450 can restart the next impulsive leg.
Medium-Term (6–18 Months)
Climb toward ₹516 → ₹555 → ₹621
Long-Term (18–36 Months)
Wave 5 targets: ₹883 → ₹999
Extended target: ₹1,250 (if PSU + energy cycle remains strong)
⭐ SUMMARY
Tata Power has completed Wave (3) and is consolidating in Wave (4).
Rising channel remains intact and very strong.
Support: ₹347–₹450
Breakout triggers Wave 5 toward ₹883 → ₹999
RSI supports long-term bullish momentum.
The stock remains in a major multi-year uptrend cycle.
⚠️ DISCLAIMER
This analysis is for educational and chart-study purposes only and is not investment advice.
Always perform your own research and consult a registered financial advisor before making trading or investment decisions.
Disclaimer
The information and publications are not meant to be, and do not constitute, financial, investment, trading, or other types of advice or recommendations supplied or endorsed by TradingView. Read more in the Terms of Use.
Disclaimer
The information and publications are not meant to be, and do not constitute, financial, investment, trading, or other types of advice or recommendations supplied or endorsed by TradingView. Read more in the Terms of Use.