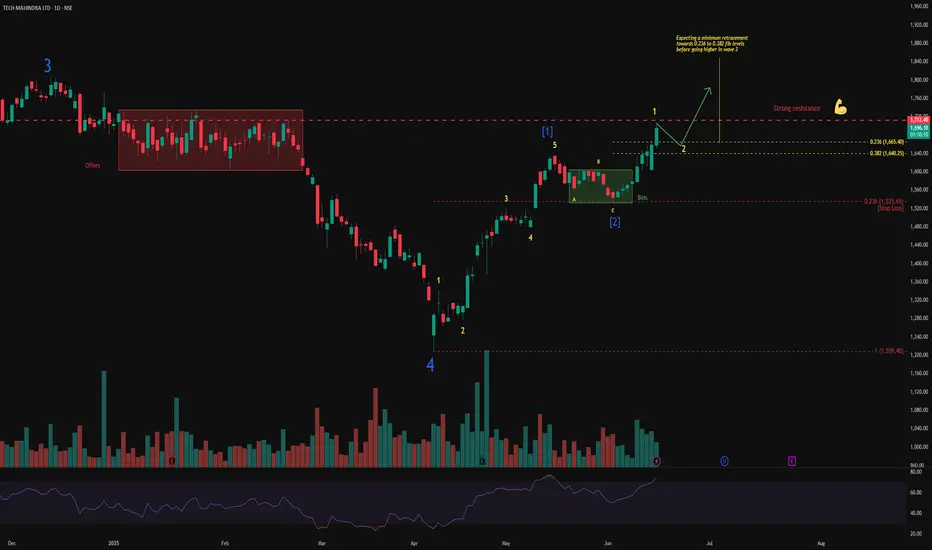
After completing Wave 4, TECHM has started a new impulsive structure. Wave [1] was followed by a clear A-B-C flat correction, forming Wave [2] near the demand zone. The recent breakout indicates the beginning of Wave 1 of a larger Wave 3.
Supporting signals:
Price is currently near the previous supply zone around ₹1712. A retracement toward the 0.382–0.236 Fibonacci levels (₹1640–₹1665) is expected before a further move higher in Wave 3.
Important levels:
The current structure remains valid as long as price holds above ₹1535.
Chart will be updated as price action evolves.
Disclaimer: This analysis is for educational purposes only and does not constitute investment advice. Please do your own research (DYOR) before making any trading decisions.
Supporting signals:
- Strong volume during impulsive rallies.
- RSI is rising but not yet in the overbought zone, indicating room for further upside.
Price is currently near the previous supply zone around ₹1712. A retracement toward the 0.382–0.236 Fibonacci levels (₹1640–₹1665) is expected before a further move higher in Wave 3.
Important levels:
- Resistance: ₹1712
- Retracement support zone: ₹1640–₹1665
- Stop loss / invalidation: ₹1535
The current structure remains valid as long as price holds above ₹1535.
Chart will be updated as price action evolves.
Disclaimer: This analysis is for educational purposes only and does not constitute investment advice. Please do your own research (DYOR) before making any trading decisions.
Note
Chart Update:Price has completed an initial retracement to the 0.236 Fibonacci level near ₹1665 after facing resistance at ₹1721. The correction is unfolding as expected. Further retracement towards the 0.382 level (₹1640) remains possible to complete Wave 2 before a potential Wave 3 advance. The larger bullish structure remains intact as long as price holds above ₹1535.
WaveXplorer | Elliott Wave insights
📊 X profile: @veerappa89
📊 X profile: @veerappa89
Disclaimer
The information and publications are not meant to be, and do not constitute, financial, investment, trading, or other types of advice or recommendations supplied or endorsed by TradingView. Read more in the Terms of Use.