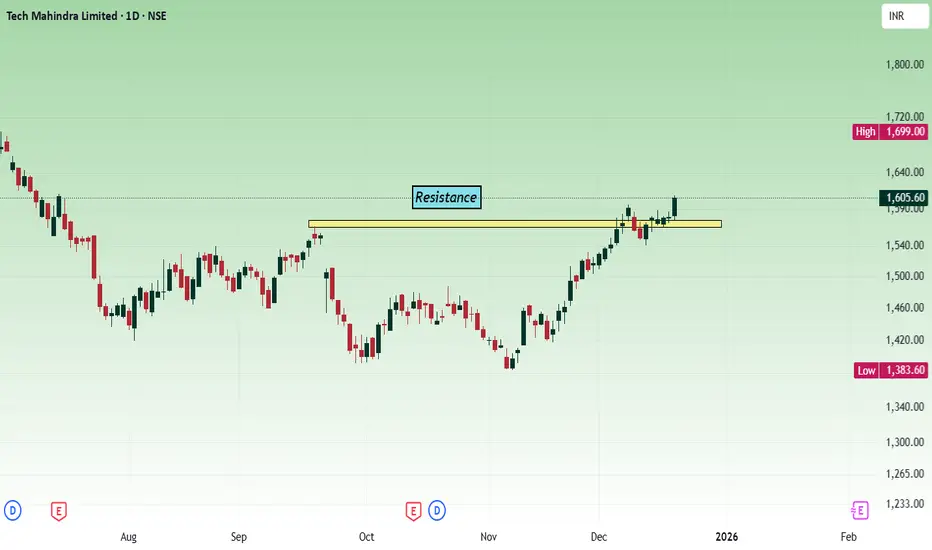
The price has broken the resistance at the 1560 - 1580 zone, unable to sustain, fall back and once again took support. Today's movement shows bullish strength.
As per the daily chart, the price has broken the trend line. Strong weekly close will confirm the bullish movement.

Buy above the 1595 - 1602 zone with the stop loss of 1580 for the targets 1616, 1630, 1648 and 1662. This analysis is for the short term.
Price should show bullish strength at the 1580 - 1600 zone. Watch how the price is showing the strength before taking any trade.
As per the daily chart, the price has broken the trend line. Strong weekly close will confirm the bullish movement.
Buy above the 1595 - 1602 zone with the stop loss of 1580 for the targets 1616, 1630, 1648 and 1662. This analysis is for the short term.
Price should show bullish strength at the 1580 - 1600 zone. Watch how the price is showing the strength before taking any trade.
Role I play here : Moderator. Follow me in telegram to trade better. t.me/Analysis4Newbie Contact information : tradingplan4u@gmail.com
Disclaimer
The information and publications are not meant to be, and do not constitute, financial, investment, trading, or other types of advice or recommendations supplied or endorsed by TradingView. Read more in the Terms of Use.