📊 Trend and Candle Pattern:
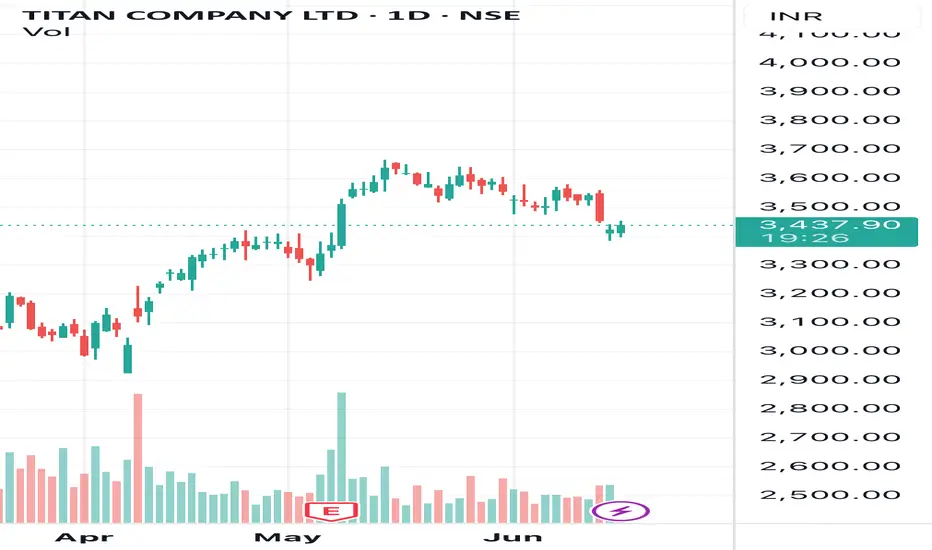
• The stock showed strong recovery between March and April.
• There was a bullish rally from April to May, reaching highs above 3600.
• After hitting resistance, it has seen a minor correction and is now trading around 3436.40.
🔴 Moving Average (Likely 200-DMA):
• The red line on the chart appears to be the 200-day moving average (DMA), which is currently at 3385.91.
• The current price is above the 200-DMA, indicating that the stock remains in a bullish zone.
• If the price falls below 3385, it may signal weakness or a trend reversal.
🧱 Support and Resistance:
• Immediate Support: 3385 (200 DMA)
• Major Support: Around 3300
• Resistance Zone: 3600–3650 (recent highs)
📈 Performance:
• The stock has shown a 5.80% gain, indicating positive momentum over the recent period.
⸻
📌 Conclusion:
• As long as the price remains above the 200-DMA (3385), the trend is bullish, and traders can consider a “buy on dips” strategy.
• A close below 3385 could trigger further downside.
• The current trend appears to be sideways to mildly bullish.
Note : not a buying or selling recommendation only for education purposes
Disclaimer
The information and publications are not meant to be, and do not constitute, financial, investment, trading, or other types of advice or recommendations supplied or endorsed by TradingView. Read more in the Terms of Use.
Disclaimer
The information and publications are not meant to be, and do not constitute, financial, investment, trading, or other types of advice or recommendations supplied or endorsed by TradingView. Read more in the Terms of Use.