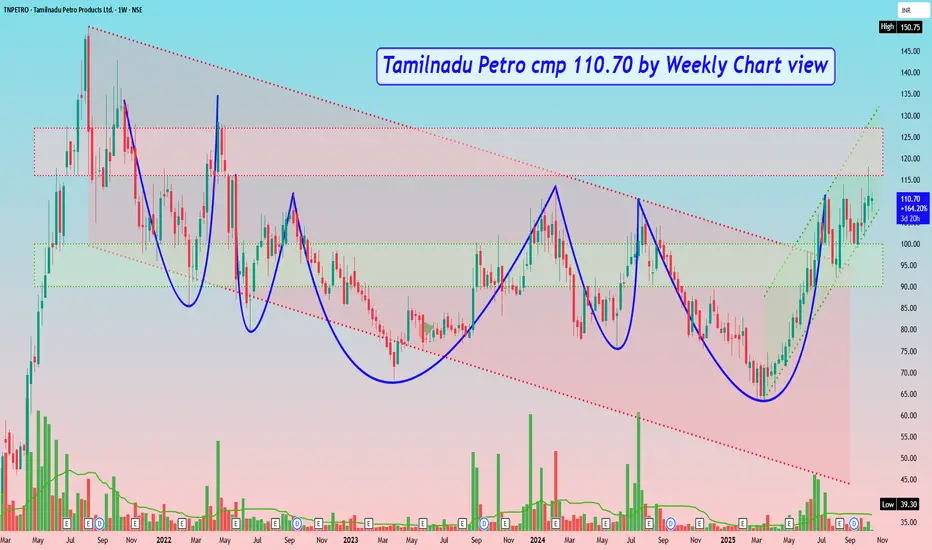
Tamilnadu Petro cmp 110.70 by Weekly Chart view
- Weekly basis : Support Zone 90 to 100 Price Band
- Weekly basis : Resistance Zone 116 to 127 Price Band
- Multiple Bullish Rounding Bottoms around Support Zone and by Resistance Zone neckline
- Price was traversing in Falling Parallel Price Channel then took Breakout moving in Rising Parallel Price Channel
- Subject to the Resistance Zone Breakout and closure sustained above it for few days, may anticipate for fresh upside probability
Disclaimer
The information and publications are not meant to be, and do not constitute, financial, investment, trading, or other types of advice or recommendations supplied or endorsed by TradingView. Read more in the Terms of Use.
Disclaimer
The information and publications are not meant to be, and do not constitute, financial, investment, trading, or other types of advice or recommendations supplied or endorsed by TradingView. Read more in the Terms of Use.