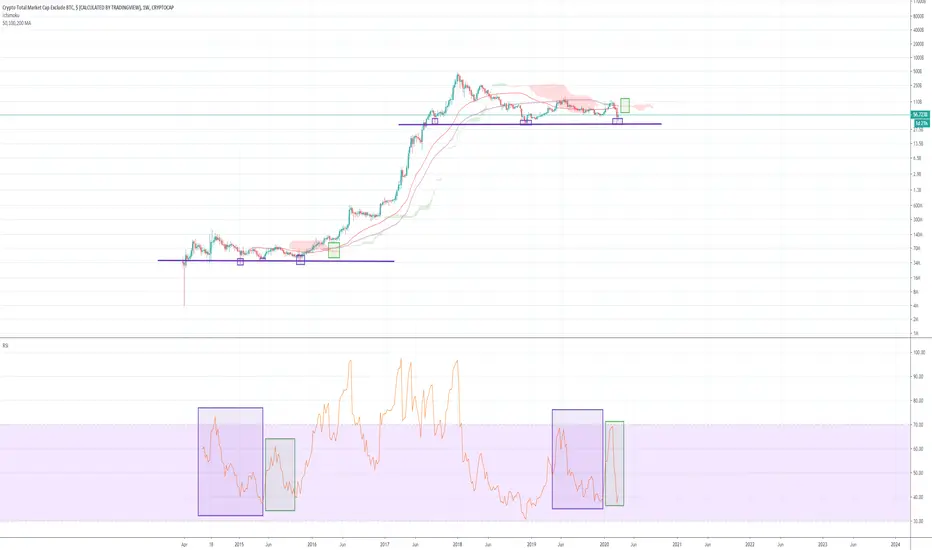
Impending golden cross on the weekly chart for the alt coin market cap! Also included a few points (purple squares) that show similarities to the previous bull run, and a RSI fractal i'm not sure if that's a thing? I know its meant to be used just for divergences but i noticed some similarities and thought i'd share. Ichimoku resistance can also be seen to be thinning which is a good sign for the golden cross. Happy trading in this crazy market!
Disclaimer
The information and publications are not meant to be, and do not constitute, financial, investment, trading, or other types of advice or recommendations supplied or endorsed by TradingView. Read more in the Terms of Use.
Disclaimer
The information and publications are not meant to be, and do not constitute, financial, investment, trading, or other types of advice or recommendations supplied or endorsed by TradingView. Read more in the Terms of Use.