🚨 TRBUSDT SMC Chart Analysis – 4H Timeframe 🚨
What’s Happening?
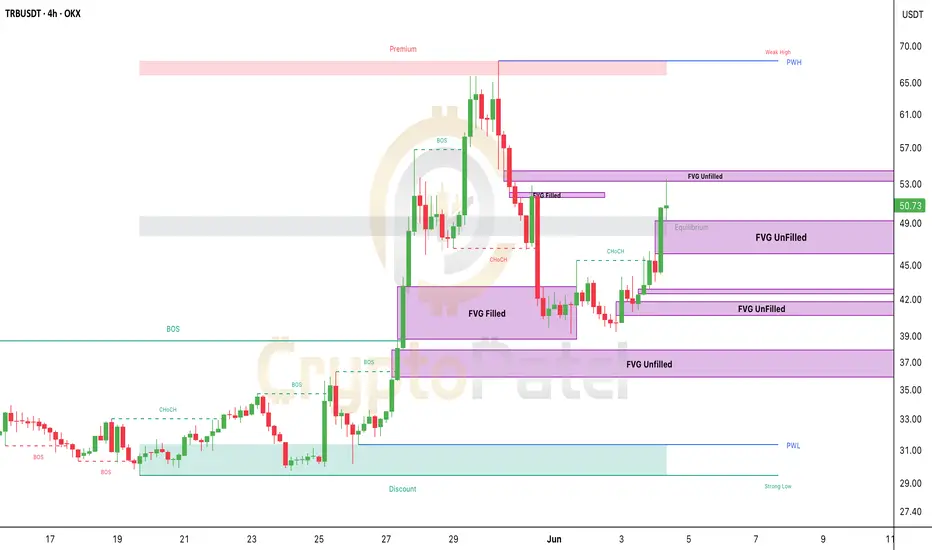
TRB is moving in a well-defined bullish structure — with multiple Breaks of Structure (BOS) and a confirmed Change of Character (CHoCH) from the lows.
Smart Money appears to be in control — hunting liquidity and filling key imbalances.
🟪 4 Unfilled Fair Value Gaps (FVGs) on the Chart:
1️⃣ $52.5 – $53.0 → Being filled now — breakout or rejection zone
2️⃣ $45.0 – $49.0 → Major demand zone — perfect for re-entries
3️⃣ $39.5 – $42.0 → If deeper retrace comes, expect reaction here
4️⃣ $36.5 – $37.8 → Extreme demand zone — last line before structure shifts
Equilibrium Zone: ~$48.50
This is the midpoint of the move. If price retests and holds → bullish continuation likely
Upside Targets:
🔼 $56 → First resistance
🔼 $69–$70 → Weak High / Liquidity Target
🔼 Above $70 → Premium Price Zone for profit-taking
Downside Risk?
If price breaks below $45 structure, expect a pullback to $42 or even $37 FVGs.
Smart Money Play:
Smart entries are near FVGs.
Exit targets near liquidity highs.
Bias = Bullish unless structure breaks down.
If TRB holds $48–49, expect a breakout toward $70.
Drop your trade plan below! 👇
What’s Happening?
TRB is moving in a well-defined bullish structure — with multiple Breaks of Structure (BOS) and a confirmed Change of Character (CHoCH) from the lows.
Smart Money appears to be in control — hunting liquidity and filling key imbalances.
🟪 4 Unfilled Fair Value Gaps (FVGs) on the Chart:
1️⃣ $52.5 – $53.0 → Being filled now — breakout or rejection zone
2️⃣ $45.0 – $49.0 → Major demand zone — perfect for re-entries
3️⃣ $39.5 – $42.0 → If deeper retrace comes, expect reaction here
4️⃣ $36.5 – $37.8 → Extreme demand zone — last line before structure shifts
Equilibrium Zone: ~$48.50
This is the midpoint of the move. If price retests and holds → bullish continuation likely
Upside Targets:
🔼 $56 → First resistance
🔼 $69–$70 → Weak High / Liquidity Target
🔼 Above $70 → Premium Price Zone for profit-taking
Downside Risk?
If price breaks below $45 structure, expect a pullback to $42 or even $37 FVGs.
Smart Money Play:
Smart entries are near FVGs.
Exit targets near liquidity highs.
Bias = Bullish unless structure breaks down.
If TRB holds $48–49, expect a breakout toward $70.
Drop your trade plan below! 👇
Twitter: twitter.com/CryptoPatel
Telegram: t.me/OfficialCryptoPatel
Instagram: instagram.com/cryptopatel?utm_medium=copy_link
Telegram: t.me/OfficialCryptoPatel
Instagram: instagram.com/cryptopatel?utm_medium=copy_link
Disclaimer
The information and publications are not meant to be, and do not constitute, financial, investment, trading, or other types of advice or recommendations supplied or endorsed by TradingView. Read more in the Terms of Use.