Technical View: Trend intact. Momentum constructive. Cycle still maturing. The RSI roadmap suggests the story is far from over — and the most explosive phase may still lie ahead.
Summary:
Back in April, we identified the $270–$320 region as a decisive long-term support zone — a confluence of the 0.382–0.5 Fibonacci retracement levels and the lower boundary of Tesla’s decade-long rising channel. That analysis has played out perfectly: TSLA retested this zone, built a solid base, and resumed its uptrend.
Today, with the stock trading above $430 and advancing toward the channel median — already within proximity of the next resistance zone around $480–$500 — the most powerful signal comes from momentum rather than price. The monthly RSI tells us something crucial: we are not near a cycle top. In fact, historical patterns suggest Tesla is entering the expansion phase of a new multi-year bull cycle, with much higher prices still ahead.
RSI and Market Cycles: What History Tells Us
Tesla’s two previous major bull markets — in 2013–2014 and 2019–2021 — followed a remarkably similar script before topping out:
Today, RSI sits near 56 — nowhere close to overbought extremes. This strongly implies that Tesla is still in the mid-cycle expansion stage — a phase historically associated with sustained institutional accumulation, accelerating price gains, and multiple expansion.
Even more importantly, if history repeats, RSI > 90 will not occur until price reaches the upper boundary or slightly breaks above it. Based on current channel geometry, that implies a potential first euphoric peak in the $1,200–$1,600 range — far above where the stock trades today.
My Prediction and Trade Idea
I believe Tesla is now in the second phase of a new multi-year bull cycle, likely playing out over the next 18–30 months. The technical setup — price structure, channel dynamics, and RSI behaviour — all point to continued upside.
My base-case roadmap:
For long-term investors and swing traders, the current risk-reward profile remains compelling. As long as Tesla holds above the $320 accumulation zone, the path of least resistance remains higher.
Profit Targets and Stop Loss
Stop-Loss Strategy:
A sustained monthly close below $320 would invalidate the mid-cycle thesis and suggest a deeper corrective structure. For traders, this remains the technical “line in the sand.”
Risks to Consider
While the technical backdrop is bullish, several risks could challenge this thesis:
Conclusion
Tesla’s long-term uptrend remains robust, key support has held, and momentum indicators show we are still early in a powerful new bull cycle. Historical RSI behaviour strongly suggests that the first euphoric phase — where RSI exceeds 90 and a true cycle top begins to form — will occur at much higher levels, likely $1,200–$1,600.
Until then, price action, structure, and momentum all point to continued appreciation. As long as support holds above $320, the base-case scenario is clear: Tesla’s next major move is higher — and the market is still writing the early chapters of this bull cycle.
Summary:
Back in April, we identified the $270–$320 region as a decisive long-term support zone — a confluence of the 0.382–0.5 Fibonacci retracement levels and the lower boundary of Tesla’s decade-long rising channel. That analysis has played out perfectly: TSLA retested this zone, built a solid base, and resumed its uptrend.
Today, with the stock trading above $430 and advancing toward the channel median — already within proximity of the next resistance zone around $480–$500 — the most powerful signal comes from momentum rather than price. The monthly RSI tells us something crucial: we are not near a cycle top. In fact, historical patterns suggest Tesla is entering the expansion phase of a new multi-year bull cycle, with much higher prices still ahead.
RSI and Market Cycles: What History Tells Us
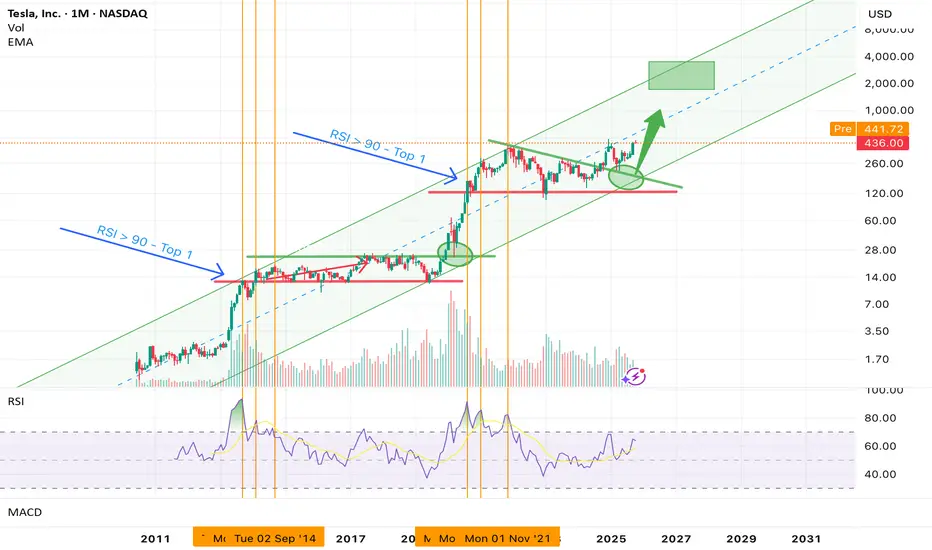
Tesla’s two previous major bull markets — in 2013–2014 and 2019–2021 — followed a remarkably similar script before topping out:
- The first euphoric peak of each cycle coincided with a monthly RSI above 90, not in the middle of the channel but as price pushed into — and slightly above — the upper boundary.
- After that first RSI > 90 event, the stock posted two higher highs with lower RSI peaks, a textbook sign of momentum exhaustion (bearish divergence).
- The result each time: a sharp correction of 45–75%.
Today, RSI sits near 56 — nowhere close to overbought extremes. This strongly implies that Tesla is still in the mid-cycle expansion stage — a phase historically associated with sustained institutional accumulation, accelerating price gains, and multiple expansion.
Even more importantly, if history repeats, RSI > 90 will not occur until price reaches the upper boundary or slightly breaks above it. Based on current channel geometry, that implies a potential first euphoric peak in the $1,200–$1,600 range — far above where the stock trades today.
My Prediction and Trade Idea
I believe Tesla is now in the second phase of a new multi-year bull cycle, likely playing out over the next 18–30 months. The technical setup — price structure, channel dynamics, and RSI behaviour — all point to continued upside.
My base-case roadmap:
- Near-term: Tesla approaches the $480–$500 resistance area (upper half of the channel) in the coming months.
- Mid-term: A breakout above $500 could trigger a sustained expansion leg toward $650–$700.
- Late-cycle: As momentum peaks and RSI nears 90, price could accelerate into the $1,200–$1,600 zone — the area historically associated with euphoric tops.
For long-term investors and swing traders, the current risk-reward profile remains compelling. As long as Tesla holds above the $320 accumulation zone, the path of least resistance remains higher.
Profit Targets and Stop Loss
- First Target: $480–$500 (upper half of the channel)
- Second Target: $650–$700 (mid-cycle breakout extension)
- Third Target: $1,200–$1,600 (historical RSI > 90 / euphoric top zone)
Stop-Loss Strategy:
A sustained monthly close below $320 would invalidate the mid-cycle thesis and suggest a deeper corrective structure. For traders, this remains the technical “line in the sand.”
Risks to Consider
While the technical backdrop is bullish, several risks could challenge this thesis:
- Macro Shifts: Higher-for-longer rates or a global recession could compress growth multiples.
- Execution Risk: Delays in autonomy, robotics, or the energy business could dampen investor enthusiasm.
- Valuation Pressure: Tesla’s premium valuation makes it sensitive to changes in growth expectations.
- Momentum Signals: If RSI fails to advance significantly during the next leg higher, it may signal internal weakness and an earlier-than-expected cycle peak.
Conclusion
Tesla’s long-term uptrend remains robust, key support has held, and momentum indicators show we are still early in a powerful new bull cycle. Historical RSI behaviour strongly suggests that the first euphoric phase — where RSI exceeds 90 and a true cycle top begins to form — will occur at much higher levels, likely $1,200–$1,600.
Until then, price action, structure, and momentum all point to continued appreciation. As long as support holds above $320, the base-case scenario is clear: Tesla’s next major move is higher — and the market is still writing the early chapters of this bull cycle.
Disclaimer
The information and publications are not meant to be, and do not constitute, financial, investment, trading, or other types of advice or recommendations supplied or endorsed by TradingView. Read more in the Terms of Use.
Disclaimer
The information and publications are not meant to be, and do not constitute, financial, investment, trading, or other types of advice or recommendations supplied or endorsed by TradingView. Read more in the Terms of Use.