The 20-period Simple Moving Average (SMA 20) is easy to calculate and widely used, though often undervalued by traders eager for novelty. Its presence is notable in popular technical indicators like Bollinger Bands and Donchian Channels. Even the most purist price action traders include it on their charts, valuing its ability to identify trends and key support and resistance levels. Today, I want to explore the practical uses traders can derive from this versatile indicator.
Behavioral Patterns
Technical Analysis emerged from the detection and study of repetitive patterns or phenomena. These patterns are intrinsically tied to investor psychology, and their influence on decision-making is fundamental.
Repetitive patterns around an SMA 20 typically indicate that a trend has strength and stability, attracting investors and paving the way for highly effective systems or methodologies. One of my favorites involves identifying entry points in strong trends that have clearly respected the SMA 20.
Figures 1 and 2 illustrate this type of approach:
Figure 1:

Figure 2:

Price Overextensions
A price overextension in trading refers to an extreme price movement that significantly deviates from its average or reference level. This phenomenon often indicates that the price has moved too far, too fast in one direction (bullish or bearish) over a short period, suggesting a potential reversal or correction.
The SMA 20 is extremely useful for visually detecting these phenomena. Moreover, when trading in high-volatility contexts like overextensions, the SMA 20 can serve as a safe exit zone.
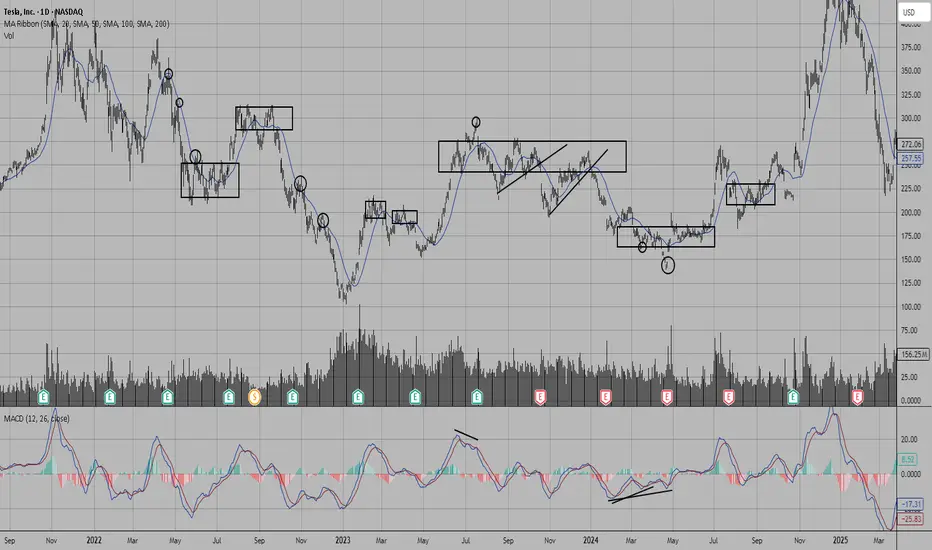
In Figure 3, you can observe how the price extends twice, significantly diverging from the SMA 20. The first overextension wouldn’t have been sufficient for an entry, but the second overextension generated a clear bearish divergence, which, combined with price action, would have validated a short entry.
The SMA 20 is a discreet target for taking profits without excessive exposure. This leverages a widely applied statistical concept in markets: mean reversion.
Figure 3:

Breakout Trading
Breakout trading involves entering the market when an asset’s price breaks through a key support or resistance level, with the expectation that the movement will continue in the breakout direction.
A price action phenomenon that significantly increases the likelihood of a successful breakout is pre-breakout tension, a state of compressed supply and demand characterized by a narrow range, low volatility, and order accumulation at key levels.
The SMA 20 is extremely useful for clearly identifying the dominance between buying and selling forces, as well as visually highlighting pre-breakout tension.
In Figure 4, I use a 20-period Exponential Moving Average (EMA 20) to increase sensitivity to the indicator’s changes.
Notice how the EMA 20 seems to compress the price against the range’s boundaries, as if trying to push it out.
Figure 4:

Retest Patterns
A retest occurs when, after breaking a significant support or resistance, opposing forces push back to test the strength of the prior level.
In Figure 5, you can see how, after a bearish breakout from an exhaustion pattern, bulls attack strongly but encounter resistance at what was previously a breached support. An SMA 20 aligned with this zone increases the level’s robustness, which is defended by sellers who see an excellent profit opportunity.
Figure 5:

Figure 6 shows an opposite example.
Figure 6:

Conclusions
With this brief overview, I aim to demonstrate that it’s not necessary to rely on novel or complex technical indicators to make sound market decisions. In Technical Analysis, simplicity, combined with deep understanding, often yields significant results.
Final Note
If you’d like to take a look at my analysis record, you can find my profile in Spanish, where I transparently share well-defined market entries. Send your good vibes if you enjoyed this article, and may God bless you all.
Behavioral Patterns
Technical Analysis emerged from the detection and study of repetitive patterns or phenomena. These patterns are intrinsically tied to investor psychology, and their influence on decision-making is fundamental.
Repetitive patterns around an SMA 20 typically indicate that a trend has strength and stability, attracting investors and paving the way for highly effective systems or methodologies. One of my favorites involves identifying entry points in strong trends that have clearly respected the SMA 20.
Figures 1 and 2 illustrate this type of approach:
Figure 1:
Figure 2:
Price Overextensions
A price overextension in trading refers to an extreme price movement that significantly deviates from its average or reference level. This phenomenon often indicates that the price has moved too far, too fast in one direction (bullish or bearish) over a short period, suggesting a potential reversal or correction.
The SMA 20 is extremely useful for visually detecting these phenomena. Moreover, when trading in high-volatility contexts like overextensions, the SMA 20 can serve as a safe exit zone.
In Figure 3, you can observe how the price extends twice, significantly diverging from the SMA 20. The first overextension wouldn’t have been sufficient for an entry, but the second overextension generated a clear bearish divergence, which, combined with price action, would have validated a short entry.
The SMA 20 is a discreet target for taking profits without excessive exposure. This leverages a widely applied statistical concept in markets: mean reversion.
Figure 3:
Breakout Trading
Breakout trading involves entering the market when an asset’s price breaks through a key support or resistance level, with the expectation that the movement will continue in the breakout direction.
A price action phenomenon that significantly increases the likelihood of a successful breakout is pre-breakout tension, a state of compressed supply and demand characterized by a narrow range, low volatility, and order accumulation at key levels.
The SMA 20 is extremely useful for clearly identifying the dominance between buying and selling forces, as well as visually highlighting pre-breakout tension.
In Figure 4, I use a 20-period Exponential Moving Average (EMA 20) to increase sensitivity to the indicator’s changes.
Notice how the EMA 20 seems to compress the price against the range’s boundaries, as if trying to push it out.
Figure 4:
Retest Patterns
A retest occurs when, after breaking a significant support or resistance, opposing forces push back to test the strength of the prior level.
In Figure 5, you can see how, after a bearish breakout from an exhaustion pattern, bulls attack strongly but encounter resistance at what was previously a breached support. An SMA 20 aligned with this zone increases the level’s robustness, which is defended by sellers who see an excellent profit opportunity.
Figure 5:
Figure 6 shows an opposite example.
Figure 6:
Conclusions
With this brief overview, I aim to demonstrate that it’s not necessary to rely on novel or complex technical indicators to make sound market decisions. In Technical Analysis, simplicity, combined with deep understanding, often yields significant results.
Final Note
If you’d like to take a look at my analysis record, you can find my profile in Spanish, where I transparently share well-defined market entries. Send your good vibes if you enjoyed this article, and may God bless you all.
📖Revista El Especulador:
drive.google.com/file/d/1Fs8l9xSpZIy5haCb5l0HWzgeAanOifs_/view?usp=drivesdk
👉t.me/ElEspeculador96 (Telegram)
drive.google.com/file/d/1Fs8l9xSpZIy5haCb5l0HWzgeAanOifs_/view?usp=drivesdk
👉t.me/ElEspeculador96 (Telegram)
Disclaimer
The information and publications are not meant to be, and do not constitute, financial, investment, trading, or other types of advice or recommendations supplied or endorsed by TradingView. Read more in the Terms of Use.