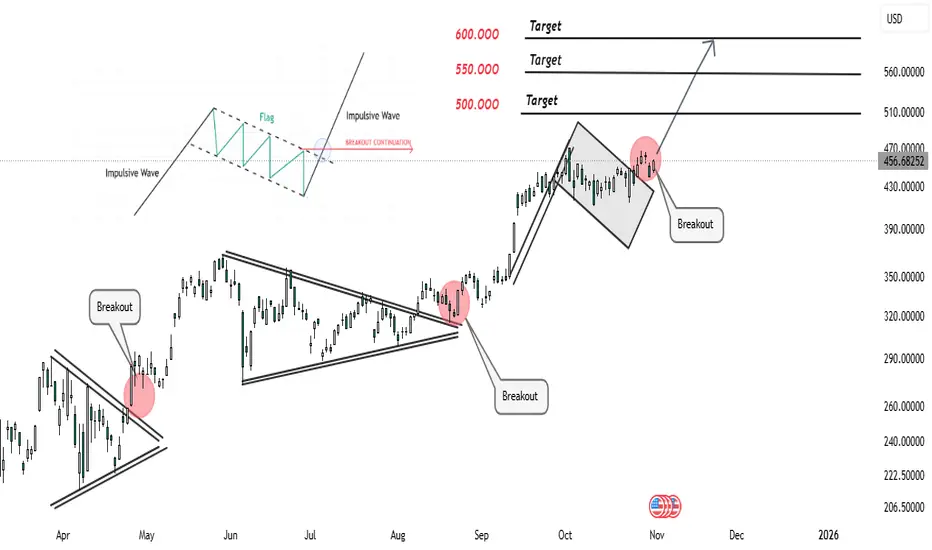
Tesla (TSLA) continues to follow a classic impulsive–corrective wave structure, showing clear signs of bullish continuation.
After each impulsive leg, price forms a consolidation pattern — such as a triangle or flag — allowing the market to gather liquidity before the next breakout.
The recent flag formation represents healthy price compression within a bullish trend, suggesting buyers are still in control.
A confirmed breakout above the flag’s resistance line indicates renewed momentum and potential for another impulsive wave targeting the 500–600 USD range.
From a technical perspective, this structure reflects:
Impulse → Correction → Impulse market rhythm.
Breakouts aligning with volume expansion and momentum continuation.
Higher highs and higher lows, confirming trend strength.
Traders can watch for price stability above the breakout level to confirm continuation. However, failure to hold above that zone may trigger a short-term pullback before the next move up.
🟢 Trend Bias: Bullish continuation
📈 Market Structure: Impulsive–Corrective wave pattern
🎯 Targets: 500 – 550 – 600 USD
📅 Outlook: Medium-term bullish momentum
Trade active
⚜️Free VIP Signals
t.me/Forexfrontierfx
⚜️Daily Market Mapping
t.me/Forexfrontierfx
⚜️Join My Refferel Broker
one.exnessonelink.com/a/uvd1etcgg1
Refferal Code -
uvd1etcgg1
t.me/Forexfrontierfx
⚜️Daily Market Mapping
t.me/Forexfrontierfx
⚜️Join My Refferel Broker
one.exnessonelink.com/a/uvd1etcgg1
Refferal Code -
uvd1etcgg1
Related publications
Disclaimer
The information and publications are not meant to be, and do not constitute, financial, investment, trading, or other types of advice or recommendations supplied or endorsed by TradingView. Read more in the Terms of Use.