UBL (United Breweries) – Weekly Swing Trading Plan
UBL (United Breweries) – Weekly Swing Trading Plan (Educational)
Structure overview
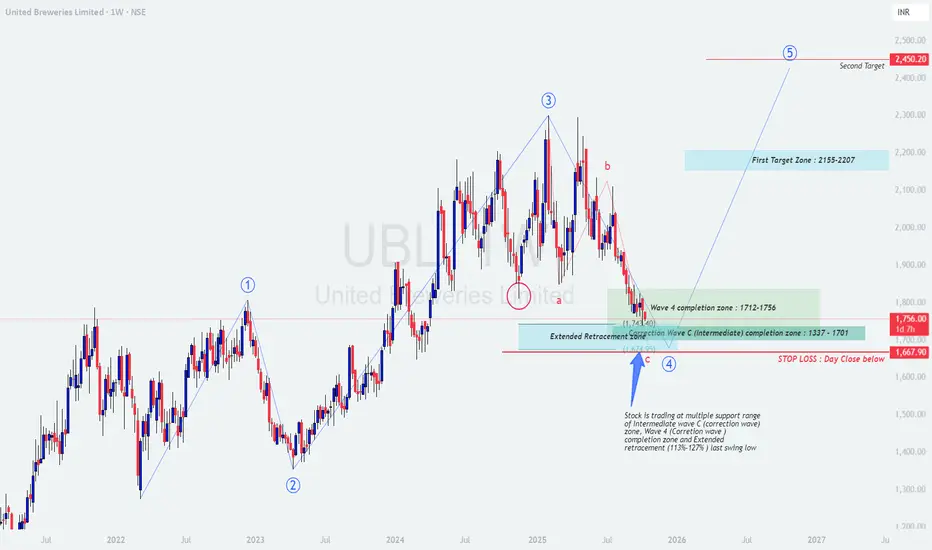
Price has completed a multi‑month corrective leg into a confluence support cluster: Wave‑4 completion zone 1712–1756 overlaps with the projected Wave‑C (intermediate) completion band 1701–1337 and the extended retracement window from the last swing 113%–127%. The market is attempting to base near this cluster with downside risk defined by the recent swing low.
Bias is accumulation-to-reversal as long as price holds above the invalidation level; confirmation improves on weekly higher low and break of the prior supply shelf.
Levels and plan
Buy zone (staggered): 1712–1756 for initial probes; add on confirmation above 1785–1800 on daily close.
Invalidation / Stop: Weekly or daily close below 1668 (recent low zone). If that fails, expect deeper extension into 1630/1600; stand aside and reassess.
Trigger confirmation: Bullish weekly candle with RSI/MACD positive cross or a daily structure break above 1825–1850 accompanied by rising volume.
First target zone: 2155–2207 (prior supply/FE confluence). Scale out 50–70% in this band.
Second target: 2450 area (projected Wave‑5/FE 1.0–1.272). Trail remainder using weekly higher‑low method.
Risk‑to‑reward: From a 1735 midpoint entry with 1668 stop, risk ≈ 67 points; to T1 midpoint 2180, reward ≈ 445 points (R≈6.6). Adjust to your execution.
Execution notes
Start with partial size in the zone; add only on strength (close back above broken EMAs or structure).
If price spikes into 1712–1756 and rejects with long lower wicks, use the next day’s high break as the tactical trigger.
If price closes below 1710 but recovers the next session and re‑enters the band, treat it as a bear trap only with clear momentum confirmation.
Trail stops to breakeven after a daily close above 1850; shift below each higher swing low on the way to T1.
Option tactics (if using derivatives)
Bull call spread when cash closes above 1825–1850: e.g., buy ATM call, sell +200 to +300 OTM to cap cost and decay.
For accumulation within 1712–1756, consider a calendar call to benefit from time if expecting a slower turn.
Exit or roll if price loses 1710 decisively; do not hold naked longs through invalidation.
Risk management
Structure overview
Price has completed a multi‑month corrective leg into a confluence support cluster: Wave‑4 completion zone 1712–1756 overlaps with the projected Wave‑C (intermediate) completion band 1701–1337 and the extended retracement window from the last swing 113%–127%. The market is attempting to base near this cluster with downside risk defined by the recent swing low.
Bias is accumulation-to-reversal as long as price holds above the invalidation level; confirmation improves on weekly higher low and break of the prior supply shelf.
Levels and plan
Buy zone (staggered): 1712–1756 for initial probes; add on confirmation above 1785–1800 on daily close.
Invalidation / Stop: Weekly or daily close below 1668 (recent low zone). If that fails, expect deeper extension into 1630/1600; stand aside and reassess.
Trigger confirmation: Bullish weekly candle with RSI/MACD positive cross or a daily structure break above 1825–1850 accompanied by rising volume.
First target zone: 2155–2207 (prior supply/FE confluence). Scale out 50–70% in this band.
Second target: 2450 area (projected Wave‑5/FE 1.0–1.272). Trail remainder using weekly higher‑low method.
Risk‑to‑reward: From a 1735 midpoint entry with 1668 stop, risk ≈ 67 points; to T1 midpoint 2180, reward ≈ 445 points (R≈6.6). Adjust to your execution.
Execution notes
Start with partial size in the zone; add only on strength (close back above broken EMAs or structure).
If price spikes into 1712–1756 and rejects with long lower wicks, use the next day’s high break as the tactical trigger.
If price closes below 1710 but recovers the next session and re‑enters the band, treat it as a bear trap only with clear momentum confirmation.
Trail stops to breakeven after a daily close above 1850; shift below each higher swing low on the way to T1.
Option tactics (if using derivatives)
Bull call spread when cash closes above 1825–1850: e.g., buy ATM call, sell +200 to +300 OTM to cap cost and decay.
For accumulation within 1712–1756, consider a calendar call to benefit from time if expecting a slower turn.
Exit or roll if price loses 1710 decisively; do not hold naked longs through invalidation.
Risk management
- Position sizing: Risk a fixed % of equity per idea (commonly 0.5–1%) based on the distance to 1668.
Staggered entries reduce timing risk; never add if invalidation is threatened.
Respect weekly closes; a weekly close below 1668 cancels the bullish thesis until a fresh base forms.
[/list=1]
Summary
Thesis: Corrective Wave‑C likely terminating around 1712–1756, setting up a potential Wave‑5 advance if 1668 holds.
Plan: Accumulate in 1712–1756, confirm above 1825–1850, aim T1 2155–2207 and T2 ~2450, with invalidation on a daily/weekly close below 1668.
Disclaimer: This post is for education, not investment advice or a trade recommendation; I am not a SEBI registered analyst.
Trade active
Buying can be considered at the most favorable risk-reward levels, where loss exposure is very limited.Disclaimer
The information and publications are not meant to be, and do not constitute, financial, investment, trading, or other types of advice or recommendations supplied or endorsed by TradingView. Read more in the Terms of Use.
Disclaimer
The information and publications are not meant to be, and do not constitute, financial, investment, trading, or other types of advice or recommendations supplied or endorsed by TradingView. Read more in the Terms of Use.