Ultra tech Cem CMP 11500
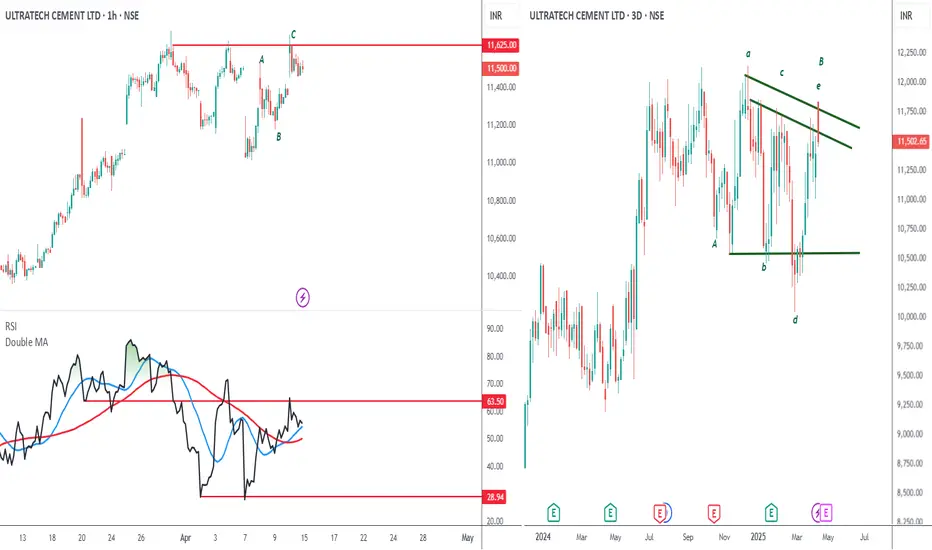
Elliott- On a higher time frame charts u see a contracting triangle. Again if u looking for a text book picture perfect its not going to happen in the real world. The e wave is done hence the triangle which is the B wave rally is over. So now we have C wave down fall from here.
On the hourly charts this rally is corrective and start of the 1st wave down of C. I will want to leave this 4 to 5% fall and wait for a pull back which will be the 2nd wave of C. The best sell if on the pull back coz the devastating 3rd of C will start from there.
RSI- If u see the oscillator on higher time frame charts from Monthly . weekly, daily. On every time frame charts the oscillator is in the bear zone. On the hourly charts too the RSI is already oscillating within the bear zone and even right now is ready to fall.
Conclusion - So for investors definitely time to book some profits as the stock is all set for a major correction. And traders its the C wave downfall.
Disclaimer
The information and publications are not meant to be, and do not constitute, financial, investment, trading, or other types of advice or recommendations supplied or endorsed by TradingView. Read more in the Terms of Use.
Disclaimer
The information and publications are not meant to be, and do not constitute, financial, investment, trading, or other types of advice or recommendations supplied or endorsed by TradingView. Read more in the Terms of Use.