Is UNI digital currency about to rebound and then plummet again?

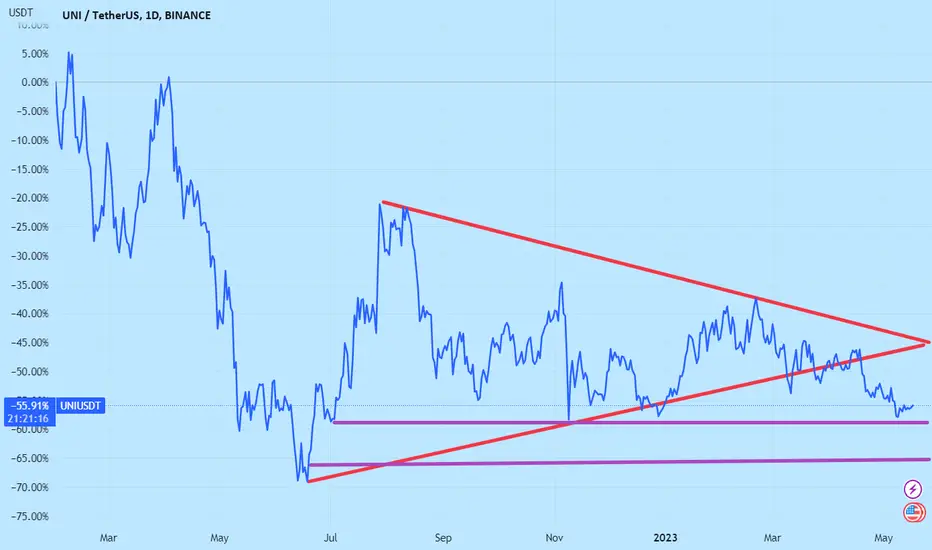
This figure shows the line chart of UNI digital currency in the latest year. The figure overlays the lines between the low and low points after the bottom of the UNI digital currency is formed, the lines between the high and high points, and the horizontal lines of the two long start positions after the bottom is made! As shown in the figure, the UNI digital currency has already broken out of the rebound triangle after bottoming out before, presenting a weak form that is about to break down. In the future, UNI digital currency will likely return to the original triangle extension line, then reverse downwards and break down to explore the lower purple horizontal line in the figure!
This figure shows the line chart of UNI digital currency in the latest year. The figure overlays the lines between the low and low points after the bottom of the UNI digital currency is formed, the lines between the high and high points, and the horizontal lines of the two long start positions after the bottom is made! As shown in the figure, the UNI digital currency has already broken out of the rebound triangle after bottoming out before, presenting a weak form that is about to break down. In the future, UNI digital currency will likely return to the original triangle extension line, then reverse downwards and break down to explore the lower purple horizontal line in the figure!
Disclaimer
The information and publications are not meant to be, and do not constitute, financial, investment, trading, or other types of advice or recommendations supplied or endorsed by TradingView. Read more in the Terms of Use.
Disclaimer
The information and publications are not meant to be, and do not constitute, financial, investment, trading, or other types of advice or recommendations supplied or endorsed by TradingView. Read more in the Terms of Use.