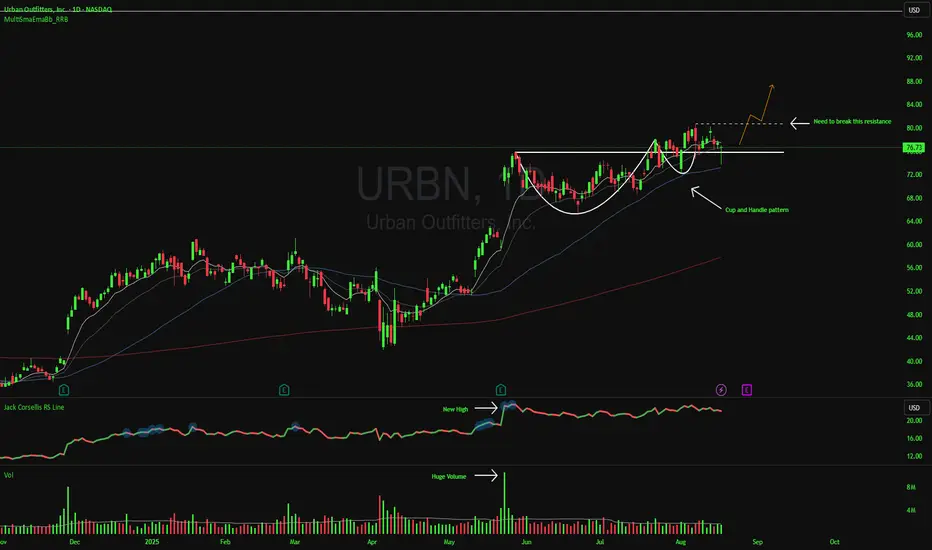
Furthermore, a Cup and Handle pattern has formed on the daily time frame. This classic bullish chart pattern has a high probability of success following a breakout. For confirmation, the price needs to break above the nearest high at $80.77.
Volume showed a significant surge on May 22, 2025.
Lastly, the company’s earnings per share (EPS) increased by 78.79%, reaching $1.18 compared to $0.66 in the same quarter of the prior year.
Disclaimer
The information and publications are not meant to be, and do not constitute, financial, investment, trading, or other types of advice or recommendations supplied or endorsed by TradingView. Read more in the Terms of Use.
Disclaimer
The information and publications are not meant to be, and do not constitute, financial, investment, trading, or other types of advice or recommendations supplied or endorsed by TradingView. Read more in the Terms of Use.