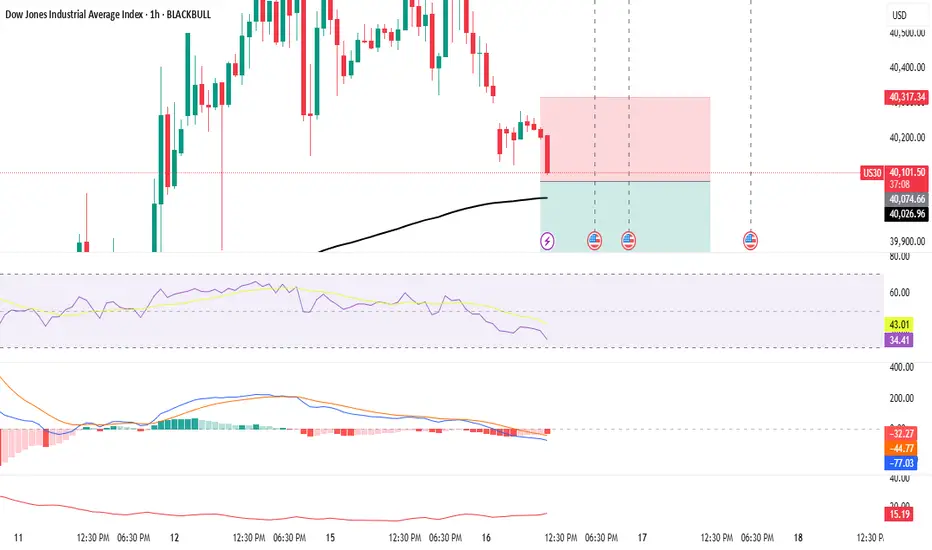
**Dow Jones (US30) - 1H chart**:
---
### 📊 Trade Setup Overview:
- **Entry:** Around 40,103.50
- **Stop Loss:** Near 40,207.50
- **Target Zone:** Around 39,811.68
- **Trade Type:** **Short/Sell**
---
### 🔍 Analysis:
#### ✅ Things Done Well:
1. **Clear Trend Direction:** Market has shown a consistent downtrend with lower highs and lower lows.
2. **Entry After Breakdown:** Your short entry came after a small consolidation and breakdown from a minor support area – solid decision.
3. **Stop Loss Placement:** Placed above the recent consolidation range – technically smart to avoid getting wicked out.
4. **Target:** Aiming near a recent demand zone (support) – realistic and risk-managed.
---
### 📉 Indicators Breakdown:
- **RSI:** Around 34 – nearing oversold, but still has room to go lower. Good timing for a short.
- **MACD:** Bearish crossover with momentum building to the downside. Supports your sell idea.
- **Volume:** Not a big spike, but enough to confirm continued seller interest.
---
### 🧠 Conclusion:
✅ **Yes, your trade idea is solid!**
You entered after confirmation, respected risk management, and are trading with the trend. The only thing to watch now is how price reacts near the **200 EMA** (black line). If it finds support there, consider booking partial profits.
---
### 💡 Pro Tip:
If the price bounces strongly off 39,800–39,900 zone, it may be wise to trail your stop or exit fully.
---
### 📊 Trade Setup Overview:
- **Entry:** Around 40,103.50
- **Stop Loss:** Near 40,207.50
- **Target Zone:** Around 39,811.68
- **Trade Type:** **Short/Sell**
---
### 🔍 Analysis:
#### ✅ Things Done Well:
1. **Clear Trend Direction:** Market has shown a consistent downtrend with lower highs and lower lows.
2. **Entry After Breakdown:** Your short entry came after a small consolidation and breakdown from a minor support area – solid decision.
3. **Stop Loss Placement:** Placed above the recent consolidation range – technically smart to avoid getting wicked out.
4. **Target:** Aiming near a recent demand zone (support) – realistic and risk-managed.
---
### 📉 Indicators Breakdown:
- **RSI:** Around 34 – nearing oversold, but still has room to go lower. Good timing for a short.
- **MACD:** Bearish crossover with momentum building to the downside. Supports your sell idea.
- **Volume:** Not a big spike, but enough to confirm continued seller interest.
---
### 🧠 Conclusion:
✅ **Yes, your trade idea is solid!**
You entered after confirmation, respected risk management, and are trading with the trend. The only thing to watch now is how price reacts near the **200 EMA** (black line). If it finds support there, consider booking partial profits.
---
### 💡 Pro Tip:
If the price bounces strongly off 39,800–39,900 zone, it may be wise to trail your stop or exit fully.
Disclaimer
The information and publications are not meant to be, and do not constitute, financial, investment, trading, or other types of advice or recommendations supplied or endorsed by TradingView. Read more in the Terms of Use.
Disclaimer
The information and publications are not meant to be, and do not constitute, financial, investment, trading, or other types of advice or recommendations supplied or endorsed by TradingView. Read more in the Terms of Use.