Closing Price: 44,935.4 (16th Aug 2025, 12:50 PM UTC+4)
Analysis Methods: Japanese Candlesticks, Harmonic Patterns (ABCD, M/W), Elliott Wave, Wyckoff, Gann Theory (Time/Square of 9/Angles), Ichimoku, RSI, Bollinger Bands, VWAP, Moving Averages (MA/EMA/SMA/WMA).
1. Long-Term Trend (Weekly/Monthly)
Elliott Wave:
Gann Price Forecasting:
Ichimoku (Monthly):
Moving Averages:
2. Medium-Term Swing (4H/Daily)
Harmonic Patterns:
Bearish ABCD on Daily:
Wyckoff Phase:
Gann Theory:
Indicators:
RSI(14) + Bollinger Bands (Daily):
Swing Trade Setup:
3. Intraday Outlook (5M–4H)
Key Levels:
Indicators:
Ichimoku (1H):
RSI + Bollinger Bands (4H):
VWAP + MAs:
Candlestick Patterns:
Gann Intraday Squaring:
Intraday Trade Plan:
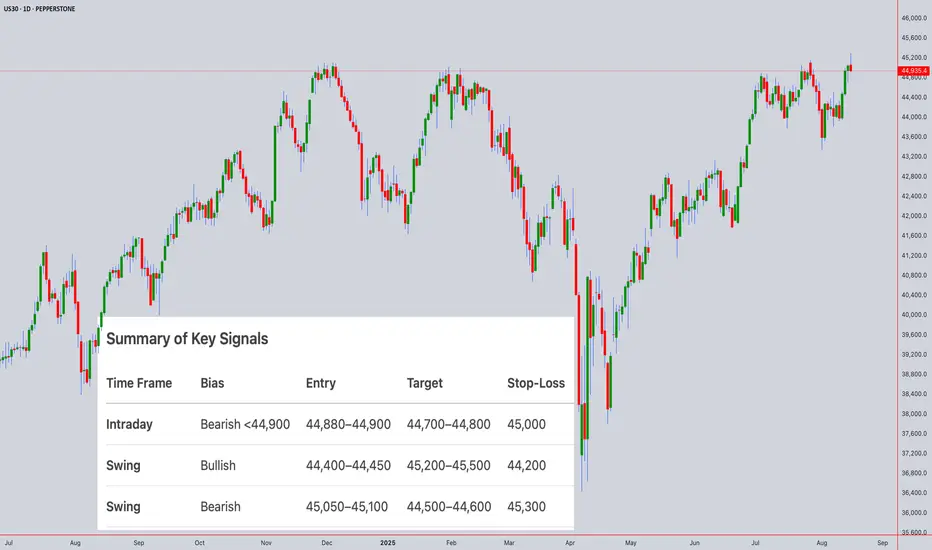
Summary of Key Signals
Time Frame Bias Entry Target Stop-Loss
Intraday Bearish <44,900 44,880–44,900 44,700–44,800 45,000
Swing Bullish 44,400–44,450 45,200–45,500 44,200
Swing Bearish 45,050–45,100 44,500–44,600 45,300
Critical Events:
Risk Note: US30 is sensitive to Dow components’ earnings and USD moves. Use tight stops during NY session.
For those interested in further developing their trading skills based on these types of analyses, consider exploring the mentoring program offered by Shunya dot Trade.(world wide web shunya dot trade)
I welcome your feedback on this analysis, as it will inform and enhance my future work.
Regards,
Shunya.Trade
world wide web shunya dot trade
⚠️ Disclaimer: This post is educational content and does not constitute investment advice, financial advice, or trading recommendations. The views expressed here are based on technical analysis and are shared solely for informational purposes. The stock market is subject to risks, including capital loss, and readers should exercise due diligence before investing. We do not take responsibility for decisions made based on this content. Consult a certified financial advisor for personalized guidance.
Analysis Methods: Japanese Candlesticks, Harmonic Patterns (ABCD, M/W), Elliott Wave, Wyckoff, Gann Theory (Time/Square of 9/Angles), Ichimoku, RSI, Bollinger Bands, VWAP, Moving Averages (MA/EMA/SMA/WMA).
1. Long-Term Trend (Weekly/Monthly)
Elliott Wave:
US30 is in Wave 5 of a bull cycle (Wave 3 peak: 45,500, Wave 4 correction to 42,800).
Target: 46,200–46,800 (1.618 extension of Wave 1).
Gann Price Forecasting:
Square of 9: √44,935.4 ≈ 212.00 →
Key resistance: 213² = 45,369, 214² = 45,796
Critical support: 211² = 44,521, 210² = 44,100
Break above 45,369 targets 46,000 (psychological level).
Ichimoku (Monthly):
Tenkan (9): 43,800 > Kijun (26): 43,200 → Bullish crossover.
Price above thick Senkou Span (42,500–43,000) – structural bullishness.
Moving Averages:
Weekly EMA(100): 43,000 (major trend support).
Swing Outlook: Bullish. Wave 5 targets 46,200–46,800.
2. Medium-Term Swing (4H/Daily)
Harmonic Patterns:
Bearish ABCD on Daily:
A: 45,200 → B: 44,300 → C: 44,900 → D: 45,050–45,150 (1.272 BC extension).
Bullish Crab (W Pattern) near 44,400 (0.886 XA retracement).
Wyckoff Phase:
Distribution above 44,900:
Upthrust rejection at 45,000 (16th Aug) on fading volume.
Weakness in rallies above 44,950.
Gann Theory:
Time Window: Aug 19–22 (Square of 9 reversal cluster).
Gann Angle: 1x1 support at 44,800 (45° angle from Aug 14 low).
Price-Time Squaring: 44,935 aligns with Aug 16 – consolidation expected.
Indicators:
RSI(14) + Bollinger Bands (Daily):
RSI: 65 (neutral-bullish, no divergence).
Price testing upper BB(20,2) at 45,050 → band expansion signals volatility.
VWAP (Weekly): 44,600 (swing support).
Swing Trade Setup:
Short near 45,050–45,150 → Target 44,500. Stop-loss: 45,300.
Long near 44,400 → Target 45,500. Stop-loss: 44,200.
3. Intraday Outlook (5M–4H)
Key Levels:
Resistance: 45,000 (psychological), 45,100 (Gann 1x1), 45,200 (ABCD target).
Support: 44,850 (VWAP), 44,750 (Ichimoku cloud), 44,600 (200-EMA).
Indicators:
Ichimoku (1H):
Tenkan: 44,920, Kijun: 44,860 → Price above both (short-term bullish).
Cloud: Bullish (44,780–44,840) – intraday support zone.
RSI + Bollinger Bands (4H):
RSI(14): 61 (neutral).
Price near mid-BB(20,2) at 44,900 → break below signals bearish momentum.
VWAP + MAs:
VWAP: 44,880 (intraday pivot).
EMA(20): 44,940 (resistance).
Candlestick Patterns:
4H Shooting Star at 45,000 → Bearish reversal signal.
1H Bearish Harami below 44,950 → Confirms selling pressure.
Gann Intraday Squaring:
Time Cycle: 14:00–16:00 UTC+4 (NY open) for volatility surge.
Price Harmony: Close below 44,900 targets 44,800 → 44,700.
Intraday Trade Plan:
Sell below 44,900 → Target 44,800 (VWAP) → 44,700 (Gann support).
Buy above 45,050 only if RSI <65 → Target 45,150.
Stop-Loss: 40–50 points.
Summary of Key Signals
Time Frame Bias Entry Target Stop-Loss
Intraday Bearish <44,900 44,880–44,900 44,700–44,800 45,000
Swing Bullish 44,400–44,450 45,200–45,500 44,200
Swing Bearish 45,050–45,100 44,500–44,600 45,300
Critical Events:
Gann Reversal Window: Aug 19–22 (watch for Fed minutes/retail data).
Daily Close >45,200 invalidates bearish patterns and targets 45,796.
Risk Note: US30 is sensitive to Dow components’ earnings and USD moves. Use tight stops during NY session.
For those interested in further developing their trading skills based on these types of analyses, consider exploring the mentoring program offered by Shunya dot Trade.(world wide web shunya dot trade)
I welcome your feedback on this analysis, as it will inform and enhance my future work.
Regards,
Shunya.Trade
world wide web shunya dot trade
⚠️ Disclaimer: This post is educational content and does not constitute investment advice, financial advice, or trading recommendations. The views expressed here are based on technical analysis and are shared solely for informational purposes. The stock market is subject to risks, including capital loss, and readers should exercise due diligence before investing. We do not take responsibility for decisions made based on this content. Consult a certified financial advisor for personalized guidance.
I am nothing @shunya.trade
Disclaimer
The information and publications are not meant to be, and do not constitute, financial, investment, trading, or other types of advice or recommendations supplied or endorsed by TradingView. Read more in the Terms of Use.
I am nothing @shunya.trade
Disclaimer
The information and publications are not meant to be, and do not constitute, financial, investment, trading, or other types of advice or recommendations supplied or endorsed by TradingView. Read more in the Terms of Use.