DOW JONES Repeating the July bullish fractal. Still time to buy!
It was just 10 days ago when we made a case for a medium-term buy on the Dow Jones index (DJI), against popular belief, as we had early signs that the index made a June 17 type bottom and was about to repeat the June-Aug rebound:

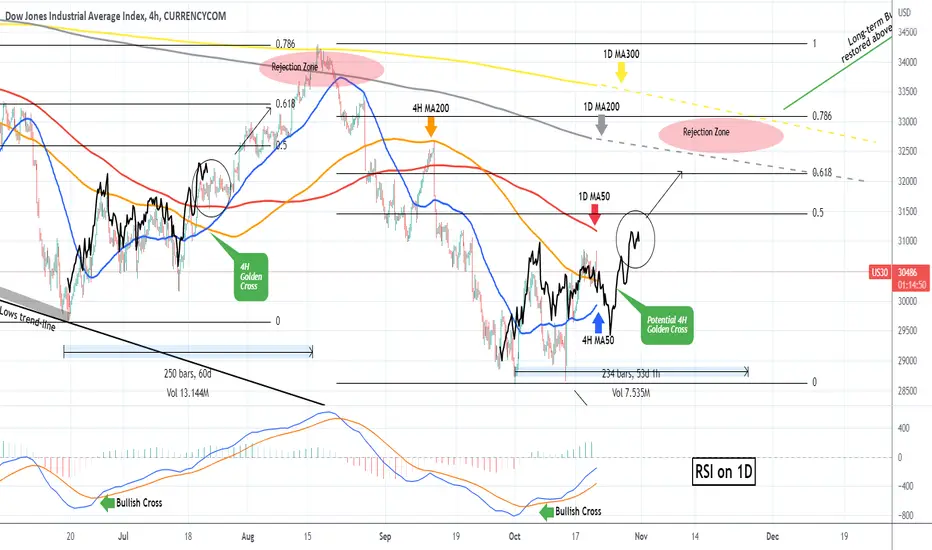
Our view has been confirmed so far and following the 1D RSI break above the Lower Highs and the 1D MACD Bullish Cross, the price quickly has come a few clicks away from the 1D MA50 (red trend-line).
Today's analysis is on the 4H time-frame, in order to get a more detailed look on the short-term. We see that Dow Jones has already broken above both the 4H MA200 (orange trend-line) and the 4H MA50 (blue trend-line) which is supporting currently. Based on the 1D RSI it seems that we are still in the early stages of this uptrend to a Lower High (at least). The 4H Golden Cross (MA50 above MA200) hasn't formed yet and in order to get a better understanding of Dow's analogous position compared to July, I've plotted the June-July sequence on today's price action (black line).
As you see, based on that, the 1D MA50 break should come by next week's end (the earliest), though of course this isn't absolute as even though similar, the current price action hasn't followed the exact pattern of June-July. Above the 1D MA50, the next volatility zone should be within the 0.5 - 0.618 Fibonacci retracement levels, making way for the rejection zone (and the medium-term target) within the 1D MA200 (grey trend-line) and the 1D MA300 (yellow trend-line).
-------------------------------------------------------------------------------
** Please LIKE 👍, SUBSCRIBE ✅, SHARE 🙌 and COMMENT ✍ if you enjoy this idea! Also share your ideas and charts in the comments section below! This is best way to keep it relevant, support me, keep the content here free and allow the idea to reach as many people as possible. **
-------------------------------------------------------------------------------
You may also TELL ME 🙋♀️🙋♂️ in the comments section which symbol you want me to analyze next and on which time-frame. The one with the most posts will be published tomorrow! 👏🎁
-------------------------------------------------------------------------------
👇 👇 👇 👇 👇 👇
💸💸💸💸💸💸
👇 👇 👇 👇 👇 👇
👑Best Signals (Forex/Crypto+70% accuracy) & Account Management (+20% profit/month on 10k accounts)
💰Free Channel t.me/tradingshotglobal
🤵Contact info@tradingshot.com t.me/tradingshot
🔥New service: next X100 crypto GEMS!
💰Free Channel t.me/tradingshotglobal
🤵Contact info@tradingshot.com t.me/tradingshot
🔥New service: next X100 crypto GEMS!
Disclaimer
The information and publications are not meant to be, and do not constitute, financial, investment, trading, or other types of advice or recommendations supplied or endorsed by TradingView. Read more in the Terms of Use.