WHY
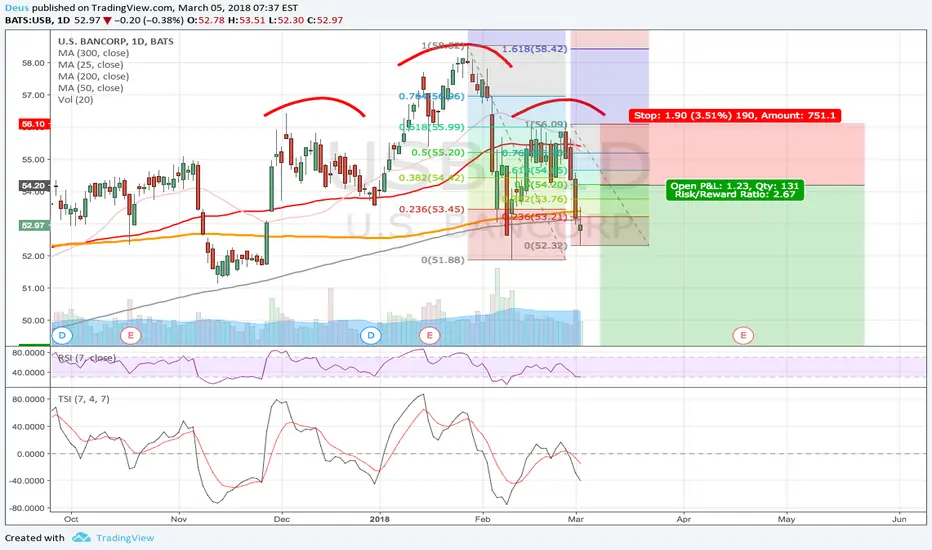
1. USB traced well pronounced head and shoulders pattern on D and W.
2. Other industry (finance) stocks such as GS, WFS also posted a reversal on W and M.
3. SPX500 seems to be looking south on W
TRADE DURATION and PROFIT TARGET
USB and market in general might be starting long bearish trend however here we target the distance to
- approximately equal to the height of the H&S structure
- 200MA on W basis (highest timeframe where pattern is visible)
- support determined by previous highs
HOW
1. Short stocks with risk reward 4.0
2. Avoid options as it can be a long story
ENTRY
Trade will be entered 4H (lower timeframe) with SL
Waiting for at least 0.5 Fibo retracement for better RtW ratio
Trade active
I guess these divergences mean lower lows ahead
➡️t.me/charta_energeia — regular Elliott Wave and trend analysis on Oil, Gas, and Crypto.
Disclaimer
The information and publications are not meant to be, and do not constitute, financial, investment, trading, or other types of advice or recommendations supplied or endorsed by TradingView. Read more in the Terms of Use.