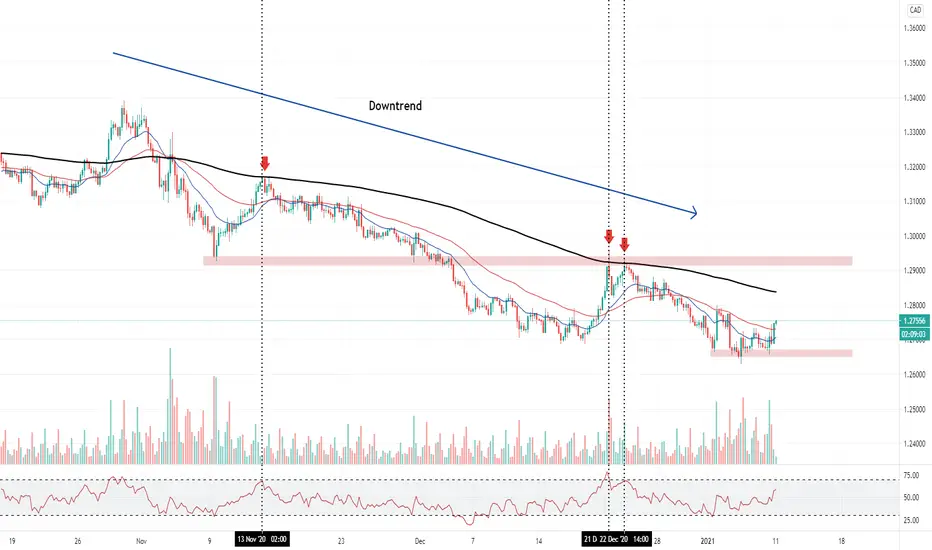
How to identify the strength of a market, properly time your entry with a sensible stop in a trending environment, when it is just grinding lower without any clear static support & resistance zones? This is when dynamic support plays an important role. In this lesson i'll be using USDCAD as an example with the Exponential Moving Averages (EMAs - 18, 50, 200 period) & Relative Strength Index (RSI - 70/ 20) both momentum indicators for demonstration purposes. As a price action trader, sometimes I do use indicators to identify the momentum of a trend & repeatable patterns.
- If you look at the previous data, you'll notice that whenever price crosses the 50ema, it usually followed by 2-4 days of rotation before further bearish pressure steps in
- Price has respected the 200ema multiple times which could be used as a filter before you place the next short position
- Whenever price approaches 200ema it always coincides with the RSI overbought condition (70 upper band), followed by bearish continuation
Hope this gives you better perspectives and how to be flexible with your trading plan by ticking the boxes, without often missing out the entire 'meat' during a trending environment if you're constantly looking for deep pullback which might never come.
Trade safe.
Do follow my profile for daily fx forecast & educational content.
Disclaimer
The information and publications are not meant to be, and do not constitute, financial, investment, trading, or other types of advice or recommendations supplied or endorsed by TradingView. Read more in the Terms of Use.
Disclaimer
The information and publications are not meant to be, and do not constitute, financial, investment, trading, or other types of advice or recommendations supplied or endorsed by TradingView. Read more in the Terms of Use.