USDT Dominance - Weekly Chart Overview
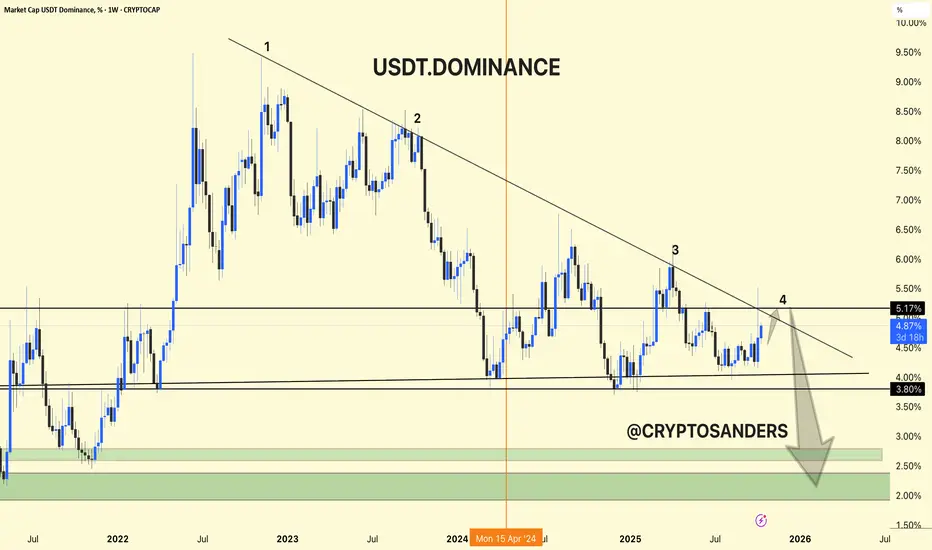
Current Level: 4.88%
Trend Structure: The chart clearly forms an aspect ratio pattern, consisting of a series of lower highs and lower lows since mid-2022.
Ascending Telgero/Declining Channel - Continuous pressure is being displayed from the ascending Telgero.
1. Key Resistance Area (5.0%–5.2%)
USDT Dominant is currently undergoing a restart test of the ascending critical line, which has acted as strong resistance several times in the past.
Every time the price retests this trend line, it corrects – indicating a shift of funds from stablecoins to crypto assets.
If the price does not close above 5.2%, it could trigger the next bearish move to the downside.
2. Support Levels
First Support: Around 3.8% – a key chocolate demand area.
Key support zone: Between 2.0%-2.5% (green zone applied).
This level is typical of the Initial Petroleum Model and historically marks major crypto bull runs.
3. Uptrend Outlook
The large downward arrow on the chart indicates a continuation of the slope.
If dominance is below 3.8%, it could move towards the 2-2.5% zone, which indicates that traders are shifting investments from USDT to BTC and altcoins – a bullish trend for the crypto market.
This means that traders are selling crypto and holding stablecoins → risk-off, fear in the market.
When USDT dominance falls:
It means that money is flowing from stablecoins to BTC and altcoins → risk-off sentiment, confidence is returning.
DYOR | NFA
Related publications
Disclaimer
The information and publications are not meant to be, and do not constitute, financial, investment, trading, or other types of advice or recommendations supplied or endorsed by TradingView. Read more in the Terms of Use.
Related publications
Disclaimer
The information and publications are not meant to be, and do not constitute, financial, investment, trading, or other types of advice or recommendations supplied or endorsed by TradingView. Read more in the Terms of Use.