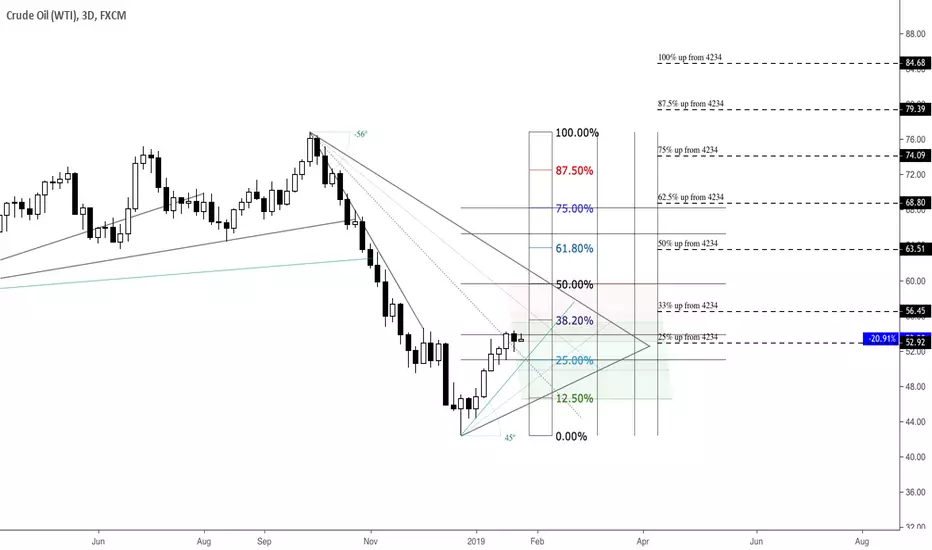
This 3 day charts shows basic retracement levels, percentage increase levels from the current low and angle relationship based support & resistance areas. So far, the oil market saw a sharp surge from the low $42, a longterm demand area, and currently it seems there's still some room for further upside. This move up can be regarded as a retracement leg within a bigger downtrend, the common retracement level being 38.20%, which falls around the $55 mark. However, there is an inverse head and shoulders pattern also noticeable on higher timeframes, so buyers might push for the 61.80% after taking some profits. Buying into weakness seems reasonable for now.
Note
As shown in the chart, oil tested the 1/3 point of the range (5385), which happens to be around the high (5454) of prior consolidation range (5454-4939) that it went through on its way down. In addition, the 25% increase point (5292) from the current low (4234) also happens to be around the same area. The current higher timeframe price action can interpreted as an accumulation range with a supply test beyond the $50 mark that was bought eagerly. If the $50 psychological level holds, it can be inferred that the supply test that took place from 14th Dec 2018 through 9th of January (covering the sub $40 range), will be the area where institutional strong hands will be sitting during the upcoming couple of quarters at least. All in all, look for clues at the $50 psychological mark. If it holds and manages to close the higher timeframes above, higher odds of a mark up phase which might see the price jump into the $60s.Note
*covering the sub $50 rangeNote
The shadow near low $51 area is a good sign for further upsideNote
Some reaction upon meeting the minor bear angle apparently.Note
Approaching the major bear angle, it seems the 25th or the 26th of February the angle should touch. Looking for bearish PA for a fading short setup confirmation.Note
Turned down leaving 10 ticks short from the major bear angle.Disclaimer
The information and publications are not meant to be, and do not constitute, financial, investment, trading, or other types of advice or recommendations supplied or endorsed by TradingView. Read more in the Terms of Use.
Disclaimer
The information and publications are not meant to be, and do not constitute, financial, investment, trading, or other types of advice or recommendations supplied or endorsed by TradingView. Read more in the Terms of Use.