Let's dive into the **technical analysis** of **Veranda Learning Solutions Ltd.** based on typical technical indicators. Since I don't have live market data, I'll guide you through a structured analysis framework. You can use real-time data from a stock charting tool to apply these indicators.
---
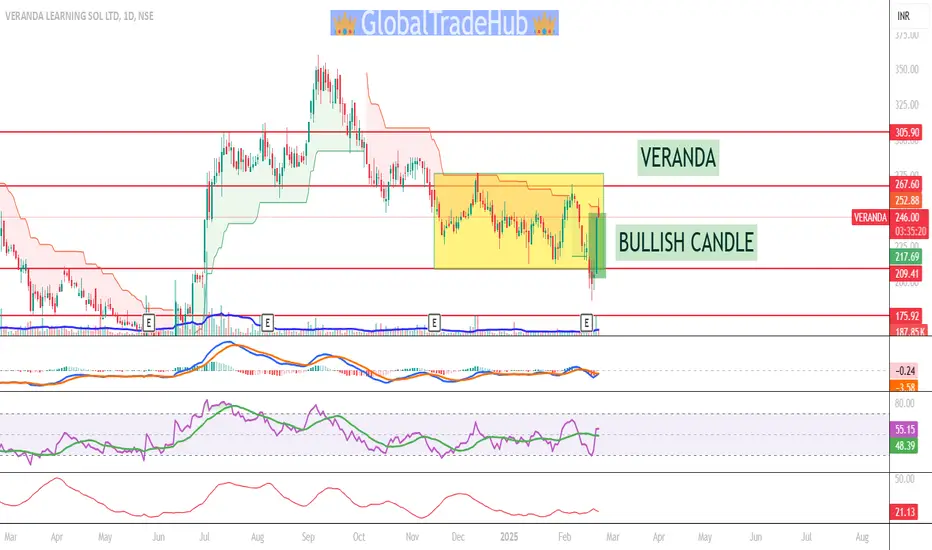
### **Technical Analysis of Veranda Learning Solutions Ltd. (VERANDA)**
#### **1. Support and Resistance Levels**
- **Support Levels:**
- These are price zones where the stock has historically found buying interest or has reversed direction.
- **Example Support Levels:** Look for recent lows. If Veranda Learning has recently bounced at ₹250 or ₹230, these could be key support levels. If the price breaks below these, it may signal further downside risk.
- If the stock is approaching these levels and starts to bounce back, these can act as buy signals.
- **Resistance Levels:**
- Resistance is where the stock has faced selling pressure in the past. If the stock has faced difficulty breaking through ₹280, ₹290, or ₹300, these levels could act as resistance.
- A breakout above these resistance levels could signal strong bullish momentum.
#### **2. Moving Averages (MA)**
- **50-day Moving Average (MA):**
- The 50-day moving average helps assess short-term price trends. If the stock is trading above this level, it generally indicates bullish momentum in the short term.
- **Example:** If the stock is at ₹270 and the 50-day MA is ₹265, this would signal short-term bullishness.
- **200-day Moving Average (MA):**
- The 200-day moving average is used for identifying the long-term trend. If the stock is trading above it, it suggests a long-term bullish trend. If below, the stock may be in a long-term downtrend.
- **Example:** If the stock is at ₹270 and the 200-day MA is at ₹260, it confirms a long-term bullish trend.
#### **3. RSI (Relative Strength Index)**
- **RSI Levels:**
- **Above 70:** Indicates the stock is potentially overbought, suggesting a pullback or consolidation could occur.
- **Below 30:** Indicates the stock is potentially oversold, suggesting it may be due for an upward move or reversal.
- **Current Example:**
- If the RSI is **above 70**, the stock could be in overbought territory, suggesting it might face a correction.
- If the RSI is **below 30**, it suggests oversold conditions, potentially indicating a buying opportunity.
#### **4. MACD (Moving Average Convergence Divergence)**
- **Bullish Signal:** When the MACD line crosses above the signal line, it suggests bullish momentum.
- **Bearish Signal:** When the MACD line crosses below the signal line, it suggests bearish momentum.
- **Current Example:**
- If the MACD is currently above the signal line, it signals potential upward momentum for the stock.
- If the MACD is below the signal line, it might indicate a downtrend or consolidation.
#### **5. Volume Analysis**
- **Increasing Volume:** When the stock rises with increasing volume, it suggests strong buying interest, confirming the trend.
- **Decreasing Volume:** If the stock rises or falls with decreasing volume, it may signal weakening momentum, either bullish or bearish.
- **Current Example:**
- If Veranda Learning is rising with increasing volume, it confirms the strength of the upward move.
- If the stock price rises but volume is decreasing, it could suggest that the rally is losing momentum and may not be sustainable.
#### **6. Candlestick Patterns**
- **Bullish Patterns:** Look for **Hammer**, **Bullish Engulfing**, or **Morning Star** patterns during a downtrend. These could signal a reversal to the upside.
- **Bearish Patterns:** Patterns like **Shooting Star**, **Evening Star**, or **Bearish Engulfing** near resistance could signal a reversal to the downside.
- **Current Example:**
- If a **Bullish Engulfing** pattern forms near a support level, it may signal a reversal to the upside.
- If a **Shooting Star** or **Evening Star** forms near a resistance level, it could indicate a potential reversal to the downside.
#### **7. Fibonacci Retracement Levels**
- Fibonacci retracement levels are often used to identify potential support or resistance areas during pullbacks or price corrections. Key levels include **23.6%, 38.2%, 50%,** and **61.8%**.
- **Current Example:**
- If the stock has moved from ₹230 to ₹300, check for retracement levels. The **38.2% retracement** might be around ₹280, and the **50% retracement** could be around ₹265.
- These levels could act as support during a pullback if the stock is in an uptrend.
---
**Disclaimer:**
- I am not a SEBI-registered professional or licensed financial advisor.
- All analysis, recommendations, and opinions provided are based solely on historical price data, patterns, and general market trends.
- Any action you take on the basis of this information is at your own risk. Please consult with a licensed financial advisor before making any investment decisions.
- Technical analysis cannot guarantee future results and may not be accurate in predicting market movements.
- Market conditions and stock prices can be influenced by many factors, including external events, news, and economic data, which are beyond the scope of this analysis.
---
### **Technical Analysis of Veranda Learning Solutions Ltd. (VERANDA)**
#### **1. Support and Resistance Levels**
- **Support Levels:**
- These are price zones where the stock has historically found buying interest or has reversed direction.
- **Example Support Levels:** Look for recent lows. If Veranda Learning has recently bounced at ₹250 or ₹230, these could be key support levels. If the price breaks below these, it may signal further downside risk.
- If the stock is approaching these levels and starts to bounce back, these can act as buy signals.
- **Resistance Levels:**
- Resistance is where the stock has faced selling pressure in the past. If the stock has faced difficulty breaking through ₹280, ₹290, or ₹300, these levels could act as resistance.
- A breakout above these resistance levels could signal strong bullish momentum.
#### **2. Moving Averages (MA)**
- **50-day Moving Average (MA):**
- The 50-day moving average helps assess short-term price trends. If the stock is trading above this level, it generally indicates bullish momentum in the short term.
- **Example:** If the stock is at ₹270 and the 50-day MA is ₹265, this would signal short-term bullishness.
- **200-day Moving Average (MA):**
- The 200-day moving average is used for identifying the long-term trend. If the stock is trading above it, it suggests a long-term bullish trend. If below, the stock may be in a long-term downtrend.
- **Example:** If the stock is at ₹270 and the 200-day MA is at ₹260, it confirms a long-term bullish trend.
#### **3. RSI (Relative Strength Index)**
- **RSI Levels:**
- **Above 70:** Indicates the stock is potentially overbought, suggesting a pullback or consolidation could occur.
- **Below 30:** Indicates the stock is potentially oversold, suggesting it may be due for an upward move or reversal.
- **Current Example:**
- If the RSI is **above 70**, the stock could be in overbought territory, suggesting it might face a correction.
- If the RSI is **below 30**, it suggests oversold conditions, potentially indicating a buying opportunity.
#### **4. MACD (Moving Average Convergence Divergence)**
- **Bullish Signal:** When the MACD line crosses above the signal line, it suggests bullish momentum.
- **Bearish Signal:** When the MACD line crosses below the signal line, it suggests bearish momentum.
- **Current Example:**
- If the MACD is currently above the signal line, it signals potential upward momentum for the stock.
- If the MACD is below the signal line, it might indicate a downtrend or consolidation.
#### **5. Volume Analysis**
- **Increasing Volume:** When the stock rises with increasing volume, it suggests strong buying interest, confirming the trend.
- **Decreasing Volume:** If the stock rises or falls with decreasing volume, it may signal weakening momentum, either bullish or bearish.
- **Current Example:**
- If Veranda Learning is rising with increasing volume, it confirms the strength of the upward move.
- If the stock price rises but volume is decreasing, it could suggest that the rally is losing momentum and may not be sustainable.
#### **6. Candlestick Patterns**
- **Bullish Patterns:** Look for **Hammer**, **Bullish Engulfing**, or **Morning Star** patterns during a downtrend. These could signal a reversal to the upside.
- **Bearish Patterns:** Patterns like **Shooting Star**, **Evening Star**, or **Bearish Engulfing** near resistance could signal a reversal to the downside.
- **Current Example:**
- If a **Bullish Engulfing** pattern forms near a support level, it may signal a reversal to the upside.
- If a **Shooting Star** or **Evening Star** forms near a resistance level, it could indicate a potential reversal to the downside.
#### **7. Fibonacci Retracement Levels**
- Fibonacci retracement levels are often used to identify potential support or resistance areas during pullbacks or price corrections. Key levels include **23.6%, 38.2%, 50%,** and **61.8%**.
- **Current Example:**
- If the stock has moved from ₹230 to ₹300, check for retracement levels. The **38.2% retracement** might be around ₹280, and the **50% retracement** could be around ₹265.
- These levels could act as support during a pullback if the stock is in an uptrend.
---
**Disclaimer:**
- I am not a SEBI-registered professional or licensed financial advisor.
- All analysis, recommendations, and opinions provided are based solely on historical price data, patterns, and general market trends.
- Any action you take on the basis of this information is at your own risk. Please consult with a licensed financial advisor before making any investment decisions.
- Technical analysis cannot guarantee future results and may not be accurate in predicting market movements.
- Market conditions and stock prices can be influenced by many factors, including external events, news, and economic data, which are beyond the scope of this analysis.
Related publications
Disclaimer
The information and publications are not meant to be, and do not constitute, financial, investment, trading, or other types of advice or recommendations supplied or endorsed by TradingView. Read more in the Terms of Use.
Related publications
Disclaimer
The information and publications are not meant to be, and do not constitute, financial, investment, trading, or other types of advice or recommendations supplied or endorsed by TradingView. Read more in the Terms of Use.