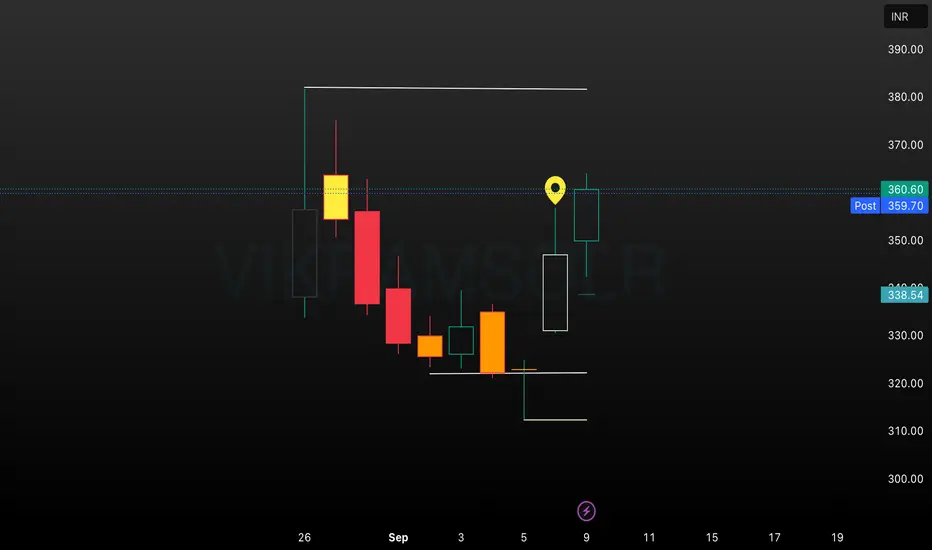
The VIKRAMSOLR daily chart illustrates a sustained recovery and momentum build-up after a series of bearish sessions. Price action rebounded from the recent low near ₹310–₹320, breaking past intermediate resistances with expanding volume and energized candlestick formation. The highlighted region signals renewed bullish participation and possible extension towards the next resistance
Disclaimer
The information and publications are not meant to be, and do not constitute, financial, investment, trading, or other types of advice or recommendations supplied or endorsed by TradingView. Read more in the Terms of Use.
Disclaimer
The information and publications are not meant to be, and do not constitute, financial, investment, trading, or other types of advice or recommendations supplied or endorsed by TradingView. Read more in the Terms of Use.