Should I buy VIMTA LABS LTD stock? Our technical rating for VIMTA LABS LTD is buy today. Note that market conditions change all the time — according to our 1 week rating the strong buy trend is prevailing, and 1 month rating shows the strong buy signal.
Vimta Labs Ltd. (NSE: VIMTALABS) is currently exhibiting a strong bullish trend, as indicated by various technical analysis indicators.
**Technical Indicators:**
- **Moving Averages:** All moving averages (5, 10, 20, 50, 100, and 200 periods) are signaling a 'Buy' or 'Strong Buy' position, suggesting sustained upward momentum. citeturn0search2
- **Relative Strength Index (RSI):** The 14-day RSI stands at 89.33, indicating that the stock is in the overbought territory. While this suggests strong momentum, it also implies a potential for price correction. citeturn0search2
- **MACD (Moving Average Convergence Divergence):** The MACD is above the signal line, reinforcing the bullish trend. citeturn0search2
- **Stochastic Oscillator:** The Stochastic Oscillator is in the overbought zone, which may indicate a potential for price pullback. citeturn0search2
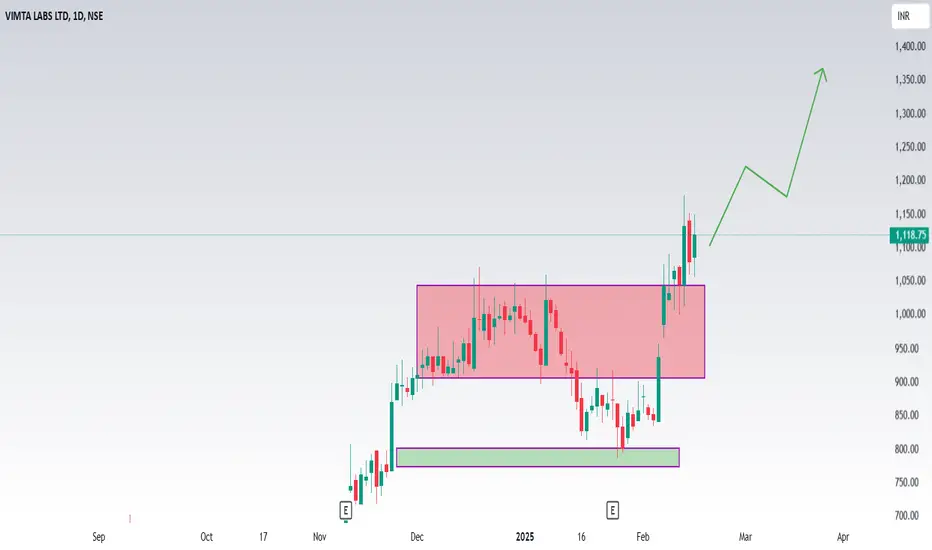
**Support and Resistance Levels:**
- **Support:** The stock has support at ₹560. citeturn0search3
- **Resistance:** The resistance level is at ₹1,020. citeturn0search3
**Volume Analysis:**
The stock has experienced high trading volumes at price peaks and lower volumes at price troughs, indicating that price movements are supported by significant trading activity. citeturn0search3
**Conclusion:**
While Vimta Labs Ltd. is currently in a strong bullish phase, the overbought conditions suggested by the RSI and Stochastic Oscillator warrant caution. Investors should monitor these indicators closely, as a price correction could occur if the stock remains in the overbought zone. It's advisable to consider these technical factors alongside fundamental analysis and broader market conditions when making investment decisions.
Vimta Labs Ltd. (NSE: VIMTALABS) is currently exhibiting a strong bullish trend, as indicated by various technical analysis indicators.
**Technical Indicators:**
- **Moving Averages:** All moving averages (5, 10, 20, 50, 100, and 200 periods) are signaling a 'Buy' or 'Strong Buy' position, suggesting sustained upward momentum. citeturn0search2
- **Relative Strength Index (RSI):** The 14-day RSI stands at 89.33, indicating that the stock is in the overbought territory. While this suggests strong momentum, it also implies a potential for price correction. citeturn0search2
- **MACD (Moving Average Convergence Divergence):** The MACD is above the signal line, reinforcing the bullish trend. citeturn0search2
- **Stochastic Oscillator:** The Stochastic Oscillator is in the overbought zone, which may indicate a potential for price pullback. citeturn0search2
**Support and Resistance Levels:**
- **Support:** The stock has support at ₹560. citeturn0search3
- **Resistance:** The resistance level is at ₹1,020. citeturn0search3
**Volume Analysis:**
The stock has experienced high trading volumes at price peaks and lower volumes at price troughs, indicating that price movements are supported by significant trading activity. citeturn0search3
**Conclusion:**
While Vimta Labs Ltd. is currently in a strong bullish phase, the overbought conditions suggested by the RSI and Stochastic Oscillator warrant caution. Investors should monitor these indicators closely, as a price correction could occur if the stock remains in the overbought zone. It's advisable to consider these technical factors alongside fundamental analysis and broader market conditions when making investment decisions.
Hello Everyone! 👋
Feel free to ask any questions. I'm here to help!
Details:
Contact : +91 7678446896
Email: skytradingmod@gmail.com
WhatsApp: wa.me/7678446896
Feel free to ask any questions. I'm here to help!
Details:
Contact : +91 7678446896
Email: skytradingmod@gmail.com
WhatsApp: wa.me/7678446896
Related publications
Disclaimer
The information and publications are not meant to be, and do not constitute, financial, investment, trading, or other types of advice or recommendations supplied or endorsed by TradingView. Read more in the Terms of Use.