🔎 Overview
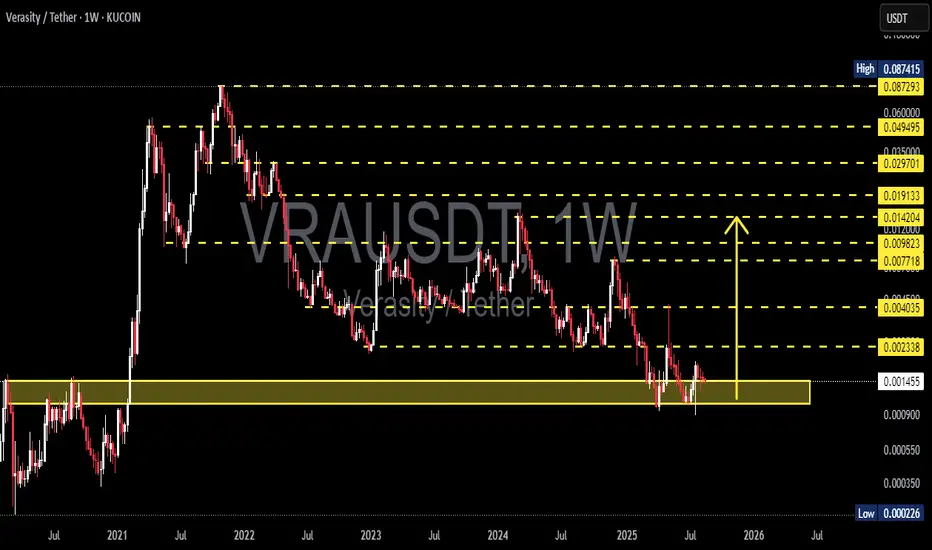
Verasity (VRA) has been in a long-term downtrend since the 2021 peak, forming consistent lower highs and lower lows. Right now, price is retesting a major historical demand zone around 0.0009 – 0.0017, an area that previously acted as a strong foundation for major rallies back in 2020–2021.
This is not just a number range, but a decision point:
👉 Will VRA confirm accumulation and reversal?
👉 Or will it break down below support and revisit historical lows?
---
📌 Key Levels (from chart)
Current price: 0.001456
Major Demand Zone (support): 0.0009 – 0.0017
Resistance levels (step-by-step):
0.002338 → 0.004035 → 0.007718 → 0.009823 → 0.014204 → 0.019133
Long-term targets: 0.029701 → 0.049495 → 0.060000 → 0.087415
Extreme historical low: 0.000226
---
📉 Structure & Pattern
Primary trend: Bearish since 2021.
Current structure: Sideways consolidation inside demand zone. Multiple long lower wicks suggest buying interest at lower levels.
Potential patterns:
Holding above 0.0009 with a higher low could evolve into an accumulation base (early stage reversal).
Failure to hold = possible continuation of downtrend toward new lows.
---
🚀 Bullish Scenario
Confirmation: Weekly close above 0.002338 with strong volume.
Upside targets:
TP1: 0.004035
TP2: 0.007718
TP3: 0.014204
TP4: 0.019133 (major supply area)
Extended targets: If the broader crypto market supports, VRA could potentially revisit 0.029–0.06 in the long term.
Strategy:
Aggressive: Scale-in within 0.0010–0.0016 demand zone, Stop Loss below 0.00085.
Conservative: Wait for breakout above 0.002338 before entering.
---
⚠️ Bearish Scenario
Confirmation: Weekly close below 0.0009 with strong selling pressure.
Downside targets:
0.0005 (psychological level)
0.000226 (historical capitulation low)
Implication: A breakdown would extend the bear cycle and delay recovery significantly.
---
📚 Extra Insights
This demand zone is essentially VRA’s “last stand” before retesting the all-time lows.
Market context matters: VRA’s ability to recover strongly depends on BTC trend and altcoin season strength.
Volume is key: Breakouts without volume are often fake; watch for strong confirmation.
---
📝 Conclusion
VRA is at a make-or-break point:
Bullish case: Hold demand zone + breakout above 0.002338 = potential multi-stage rally.
Bearish case: Breakdown below 0.0009 = opens path to 0.0005 → 0.000226.
📌 Short-term traders should watch 0.002338 as the breakout trigger.
📌 Long-term investors may see this zone as an accumulation opportunity — but risk management with strict stops is essential.
#VRAUSDT #Verasity #Crypto #AltcoinAnalysis #CryptoTrading #SupportResistance #TechnicalAnalysis #WeeklyChart #SupplyDemand
✅ Get Free Signals! Join Our Telegram Channel Here: t.me/TheCryptoNuclear
✅ Twitter: twitter.com/crypto_nuclear
✅ Join Bybit : partner.bybit.com/b/nuclearvip
✅ Benefits : Lifetime Trading Fee Discount -50%
✅ Twitter: twitter.com/crypto_nuclear
✅ Join Bybit : partner.bybit.com/b/nuclearvip
✅ Benefits : Lifetime Trading Fee Discount -50%
Disclaimer
The information and publications are not meant to be, and do not constitute, financial, investment, trading, or other types of advice or recommendations supplied or endorsed by TradingView. Read more in the Terms of Use.