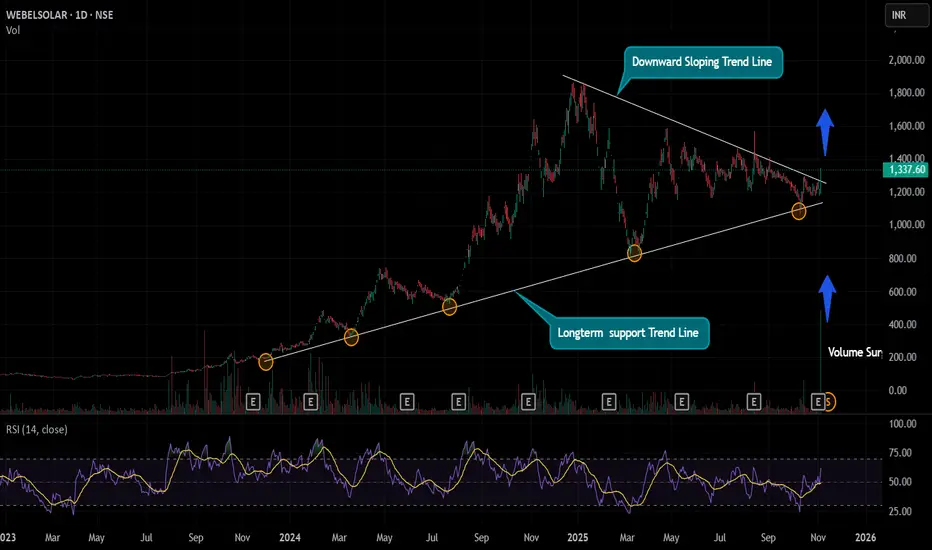
This is the daily chart of the Websol Energy System Ltd. The stock is respecting the 2 years upward sloping trendline and trying to come out of the resistance line with good volume.
Today the move was more than 10% with surge in the volume
RSI is above 60 indicating the price movement is strong.
If the stock stays above 1250 for couple of days than it could give a positive move in the short term.
Today the move was more than 10% with surge in the volume
RSI is above 60 indicating the price movement is strong.
If the stock stays above 1250 for couple of days than it could give a positive move in the short term.
Disclaimer
The information and publications are not meant to be, and do not constitute, financial, investment, trading, or other types of advice or recommendations supplied or endorsed by TradingView. Read more in the Terms of Use.
Disclaimer
The information and publications are not meant to be, and do not constitute, financial, investment, trading, or other types of advice or recommendations supplied or endorsed by TradingView. Read more in the Terms of Use.