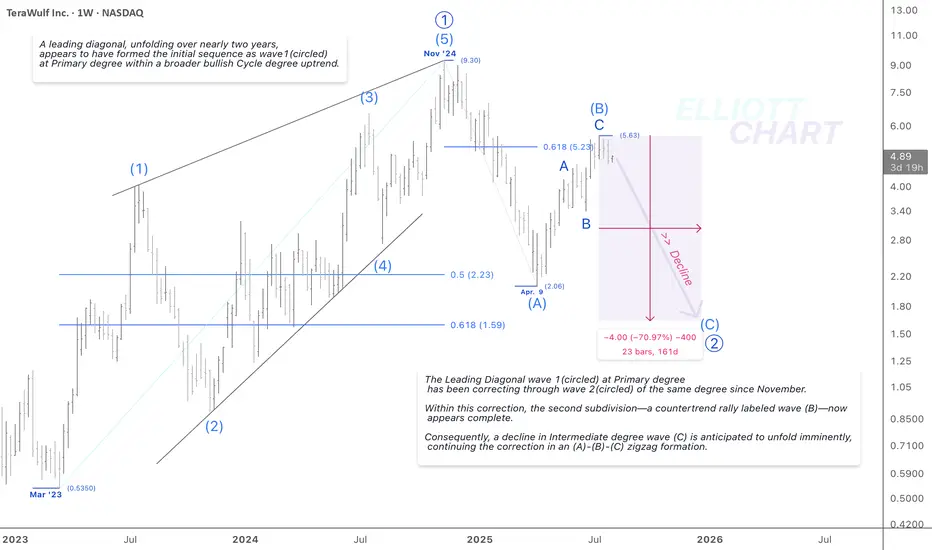
As illustrated on the weekly chart of  WULF, the entire advance since March 2023 appears to have unfolded as a Leading Diagonal, forming a bullish pattern over nearly two years.
This structure likely represents wave 1(circled) at the Primary degree, marking the initial sequence within a broader Cycle degree uptrend.
The Leading Diagonal wave 2(circled) has been undergoing a correction through wave 2(circled) of the same degree since November.
Within this corrective phase, the second subdivision—a countertrend rally labeled wave (B)—has extended beyond the 0.618 Fibonacci retracement level as anticipated and now appears to be a completed corrective structure.
Consequently, a decline of up to 70% is anticipated in the Intermediate degree wave (C), continuing the overall correction in a (A)-(B)-(C) Zigzag formation. It potentially extends through the remainder of the year.
Trend Analysis >> Under this weekly alternative, the medium-term trend is expected to turn lower very soon. However, the Leading Diagonal, identified as the first wave at the Primary degree, aligns with a broader long-term bullish structure, reinforcing the strength of the prevailing Cycle degree uptrend.
WULF  BTC BTCUSD $MARKETSCOM:BITCOIN
#CryptoStocks #WULF #BTCMining #Bitcoin #BTC
This structure likely represents wave 1(circled) at the Primary degree, marking the initial sequence within a broader Cycle degree uptrend.
The Leading Diagonal wave 2(circled) has been undergoing a correction through wave 2(circled) of the same degree since November.
Within this corrective phase, the second subdivision—a countertrend rally labeled wave (B)—has extended beyond the 0.618 Fibonacci retracement level as anticipated and now appears to be a completed corrective structure.
Consequently, a decline of up to 70% is anticipated in the Intermediate degree wave (C), continuing the overall correction in a (A)-(B)-(C) Zigzag formation. It potentially extends through the remainder of the year.
Trend Analysis >> Under this weekly alternative, the medium-term trend is expected to turn lower very soon. However, the Leading Diagonal, identified as the first wave at the Primary degree, aligns with a broader long-term bullish structure, reinforcing the strength of the prevailing Cycle degree uptrend.
#CryptoStocks #WULF #BTCMining #Bitcoin #BTC
Disclaimer
The information and publications are not meant to be, and do not constitute, financial, investment, trading, or other types of advice or recommendations supplied or endorsed by TradingView. Read more in the Terms of Use.
Disclaimer
The information and publications are not meant to be, and do not constitute, financial, investment, trading, or other types of advice or recommendations supplied or endorsed by TradingView. Read more in the Terms of Use.