Hello Traders! 👋
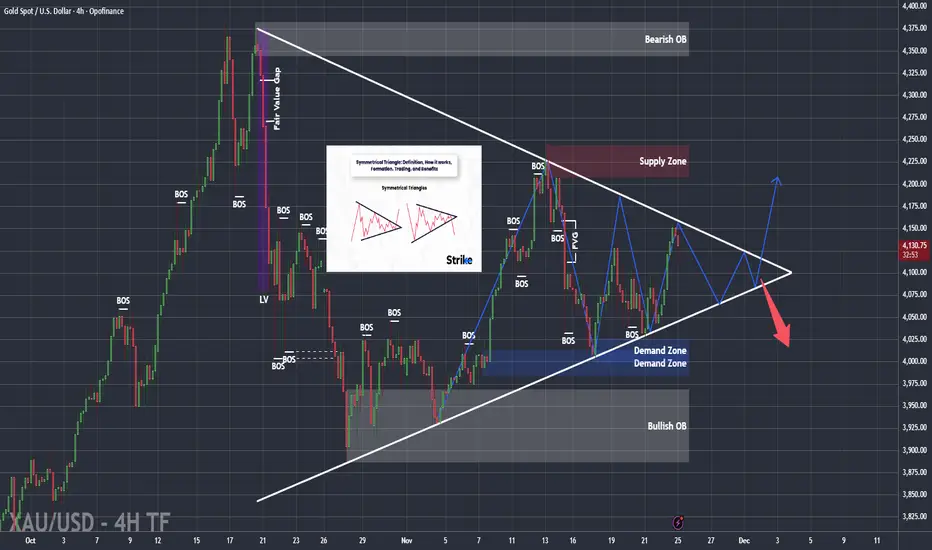
- GOLD has once again reacted to the 4120–4140 resistance zone, which also aligns with the upper boundary of the Symmetrical Triangle. The price is forming lower highs, signaling weakening buying pressure and the return of short-term bearish momentum.
1. Key Technical Highlights
- Strong rejection at 4120–4140 (major Supply Zone + triangle resistance).
- Price continues to form lower highs, confirming seller presence.
- Market is consolidating inside a Symmetrical Triangle, showing compression and indecision.
- Key support area to watch: 4040–4060 (Demand Zone + triangle support).
- Short-term trend: bearish correction.
- Medium-term trend: sideways / consolidation inside the triangle.
2. Symmetrical Triangle – What It Means for GOLD
Based on the chart:
🔸 Upper trendline: descending – each retest creates a lower high.
🔸 Lower trendline: ascending – buyers are defending higher lows.
This structure forms a Symmetrical Triangle, indicating:
➡️ The market is building pressure and waiting for a major breakout.
➡️ Short-term bias favors a move toward the lower boundary due to the latest rejection at resistance.
Given current price behavior:
👉 GOLD is likely to drop toward 4060,
and potentially test 4040, the base of the triangle.
3. Price Expectation
If GOLD continues to fail at the 4140 resistance, the expected move is:
👉 TP1: 4060
👉 TP2: 4040
At 4040–4060, the market will likely decide the next big move:
1️⃣ Strong bullish reaction → triangle compression continues
2️⃣ Breakdown below 4040 → bearish breakout confirmed
4. Trade Signal (Technical Setup)
🔻 Preferred Sell Setup
Sell Zone: 4120–4140
➡️ This setup aligns with rejection at the triangle’s upper boundary + resistance.
5. Alternative Scenario
-If GOLD breaks above the Symmetrical Triangle and closes firmly above 4140: Short-term trend flips bullish
- Upside targets open toward: 4175- 4200 and potentially the higher bearish order block area
6. Risk Notes
- Symmetrical Triangles can produce false breakouts, so wait for candle confirmation.
- Avoid entering trades in the middle of the triangle, where risk is high.
- Best entries occur at the edges of the structure: 4120–4140 or 4040–4060.
Conclusion
- GOLD remains inside a Symmetrical Triangle, currently showing weakness at the upper boundary. With lower highs forming and supply active at 4120–4140, selling from resistance remains the preferred strategy.
- The market remains sideways until we get a decisive break above 4140 or below 4040.
What are your thoughts on GOLD? Comment now or join my group to trade with me on description
- GOLD has once again reacted to the 4120–4140 resistance zone, which also aligns with the upper boundary of the Symmetrical Triangle. The price is forming lower highs, signaling weakening buying pressure and the return of short-term bearish momentum.
1. Key Technical Highlights
- Strong rejection at 4120–4140 (major Supply Zone + triangle resistance).
- Price continues to form lower highs, confirming seller presence.
- Market is consolidating inside a Symmetrical Triangle, showing compression and indecision.
- Key support area to watch: 4040–4060 (Demand Zone + triangle support).
- Short-term trend: bearish correction.
- Medium-term trend: sideways / consolidation inside the triangle.
2. Symmetrical Triangle – What It Means for GOLD
Based on the chart:
🔸 Upper trendline: descending – each retest creates a lower high.
🔸 Lower trendline: ascending – buyers are defending higher lows.
This structure forms a Symmetrical Triangle, indicating:
➡️ The market is building pressure and waiting for a major breakout.
➡️ Short-term bias favors a move toward the lower boundary due to the latest rejection at resistance.
Given current price behavior:
👉 GOLD is likely to drop toward 4060,
and potentially test 4040, the base of the triangle.
3. Price Expectation
If GOLD continues to fail at the 4140 resistance, the expected move is:
👉 TP1: 4060
👉 TP2: 4040
At 4040–4060, the market will likely decide the next big move:
1️⃣ Strong bullish reaction → triangle compression continues
2️⃣ Breakdown below 4040 → bearish breakout confirmed
4. Trade Signal (Technical Setup)
🔻 Preferred Sell Setup
Sell Zone: 4120–4140
- Stop Loss: above 4160
- Take Profit 1: 4080
- Take Profit 2: 4060
- Take Profit 3: 4040
➡️ This setup aligns with rejection at the triangle’s upper boundary + resistance.
5. Alternative Scenario
-If GOLD breaks above the Symmetrical Triangle and closes firmly above 4140: Short-term trend flips bullish
- Upside targets open toward: 4175- 4200 and potentially the higher bearish order block area
6. Risk Notes
- Symmetrical Triangles can produce false breakouts, so wait for candle confirmation.
- Avoid entering trades in the middle of the triangle, where risk is high.
- Best entries occur at the edges of the structure: 4120–4140 or 4040–4060.
Conclusion
- GOLD remains inside a Symmetrical Triangle, currently showing weakness at the upper boundary. With lower highs forming and supply active at 4120–4140, selling from resistance remains the preferred strategy.
- The market remains sideways until we get a decisive break above 4140 or below 4040.
What are your thoughts on GOLD? Comment now or join my group to trade with me on description
Trade active
The signals and overall market structure are still moving exactly in line with my initial projection. Now, all we need to do is wait for price to show enough strength to finally break out of this symmetrical triangle.Price action is always challenging to read — it looks simple on the surface, yet it becomes extremely difficult without real experience and time in the market. Only through consistent observation and deep understanding of market behavior can you recognize what others miss.
A breakout is coming. Let the market show its hand, and we’ll be ready for the next move.
Trade closed manually
UPDATE: THIS IS THE PERFECT ENTRY — THE MARKET JUST CONFIRMED OUR SIGNALThe market is moving exactly as projected, and we’ve finally reached the ideal BUY zone with all technical signals aligning.
This is the moment we’ve been waiting for — clean structure, clear liquidity, and price reacting precisely at our expected levels.
Right now, price is showing early signs of strength inside the 4142–4146 BUY zone, confirming our bullish setup before the breakout.
When the market gives us this kind of precision, we don’t hesitate — we execute.
This is a high-probability entry with asymmetric risk–reward:
✅ BUY NOW: 4142 – 4146
❎ Stop Loss: 4135
🎯 TP1: 4150 – 4160
🎯 TP2: 4170 – 4200
🎯 TP3: OPEN
This breakout is loading — don’t miss the move when the market is clearly giving us the signal.
Execute with discipline, follow the levels, and let price do the rest.
MY COMMUNITY GROUP GET FREE SIGNAL
✅ 100% Free — I don’t take a penny from anyone
✅ Free Signal: 4 - 6 signals
✅ Trading Idea / Setup / Technical
✅ JOIN MY COMMUNITY GROUP IN Telegram:
t.me/+vxDQ4bhDfsw3MGU1
✅ 100% Free — I don’t take a penny from anyone
✅ Free Signal: 4 - 6 signals
✅ Trading Idea / Setup / Technical
✅ JOIN MY COMMUNITY GROUP IN Telegram:
t.me/+vxDQ4bhDfsw3MGU1
Related publications
Disclaimer
The information and publications are not meant to be, and do not constitute, financial, investment, trading, or other types of advice or recommendations supplied or endorsed by TradingView. Read more in the Terms of Use.