September 8 Gold Trend Analysis and Trading Strategy:
Strong market expectations of a Fed rate cut pushed gold prices to a record high. Technical overbought signals suggest increased short-term volatility.
1. Fundamental Analysis
Weak non-farm payroll data: US non-farm payrolls increased by only 22,000 in August, far below market expectations of 75,000, and the June figure was revised downward to -13,000. The unemployment rate rose to 4.3%, the highest level since 2021, indicating a significant deterioration in the labor market.
Rate Cut Expectations Strengthened: Weak non-farm payroll data has significantly increased market expectations for a Fed rate cut in September. Current futures market pricing indicates a near-100% probability of a 25 basis point rate cut in September, with an even approximately 10% chance of a 50 basis point cut.
The US dollar and US Treasury yields fell: Following the release of the non-farm payroll data, the US dollar index fell nearly 0.6% to 97.74; the US 10-year Treasury yield fell over 8.5 basis points to 4.076%, providing strong support for gold prices.
Risk Factors: Despite rising expectations for rate cuts, inflationary pressures have not completely subsided. Price uncertainty caused by Trump's tariff rhetoric may limit the Fed's pace of easing. An unexpectedly higher CPI data next week could limit the extent of rate cuts.
2 Technical Analysis
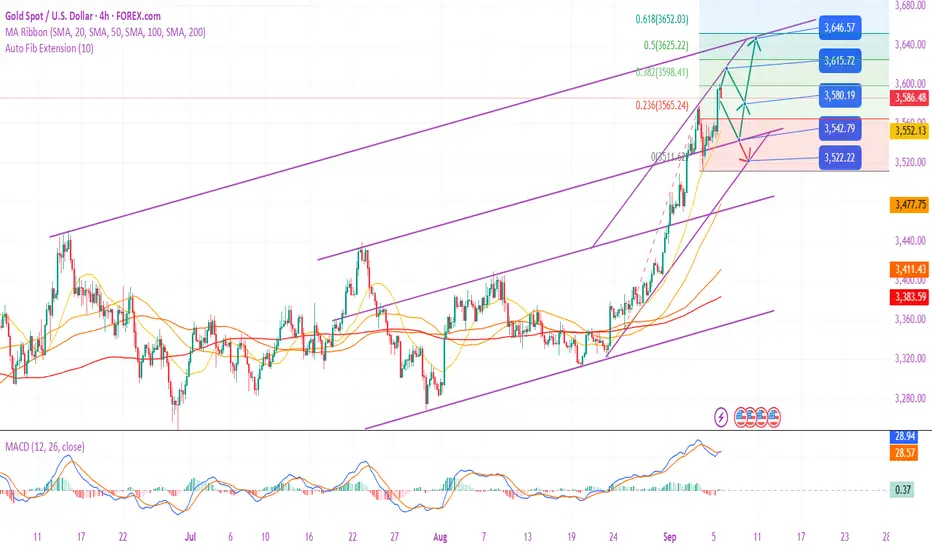
Daily Chart: Gold closed lower for the first time after seven consecutive days of gains, but this is typically a single-day correction. The 5-day moving average has moved up to the 3550-3545 area, becoming a key support level. As long as gold prices hold this level, the strong unilateral upward trend will remain unchanged.
4-Hour Chart: The middle Bollinger Band (3555 area) provides important support. A break above this level will maintain a relatively strong trend; a break could trigger a periodic pullback.
Technical indicators: The relative strength index (RSI) is in overbought conditions, indicating that there may be a risk of a technical pullback in the short term.
Key Levels:
Resistance: $3,600-3,610 (round-number level + historical high)
Support: $3,570-3,560 (recent swing low), $3,550-3,545 (5-day moving average)
Next Week's Forecast
Based on a comprehensive analysis of fundamentals and technicals, gold is likely to maintain its strong performance next week, but a technical correction is possible. The market will closely watch the CPI data released next week, which will provide more clues on the Fed's policy path.
4. Trading Strategy Recommendations:
Short-term traders can adopt a strategy of "primarily buying on dips, supplemented by selling on rebounds":
Long Opportunities: Consider going long when gold prices stabilize at the 3570-3560 support level, with a target of 3600-3610 and a stop-loss below 3550.
Short Opportunities: Consider going short when gold prices rebound to the 3600-3610 resistance level, with a target of 3580 and a stop-loss above 3620.
Medium- to long-term investors should continue to hold long gold positions, and any technical pullbacks should be considered as opportunities to increase their holdings. The gold bull market is not over, and the possibility of gold reaching a new all-time high in 2025 remains high.
Risk control is crucial:
Avoid excessive leverage.
Set a reasonable stop-loss (exit long positions if the price falls below $3540).
5. Conclusion
The gold market has entered a sensitive zone after reaching a new all-time high. Given the intertwined bullish and bearish factors, be wary of high volatility risks. The overall trend remains bullish, but there may be short-term fluctuations due to technical overbought and high valuations. Any pullback can be seen as a buying opportunity, with a focus on the performance of the 3550-3555 support area.
Strong market expectations of a Fed rate cut pushed gold prices to a record high. Technical overbought signals suggest increased short-term volatility.
1. Fundamental Analysis
Weak non-farm payroll data: US non-farm payrolls increased by only 22,000 in August, far below market expectations of 75,000, and the June figure was revised downward to -13,000. The unemployment rate rose to 4.3%, the highest level since 2021, indicating a significant deterioration in the labor market.
Rate Cut Expectations Strengthened: Weak non-farm payroll data has significantly increased market expectations for a Fed rate cut in September. Current futures market pricing indicates a near-100% probability of a 25 basis point rate cut in September, with an even approximately 10% chance of a 50 basis point cut.
The US dollar and US Treasury yields fell: Following the release of the non-farm payroll data, the US dollar index fell nearly 0.6% to 97.74; the US 10-year Treasury yield fell over 8.5 basis points to 4.076%, providing strong support for gold prices.
Risk Factors: Despite rising expectations for rate cuts, inflationary pressures have not completely subsided. Price uncertainty caused by Trump's tariff rhetoric may limit the Fed's pace of easing. An unexpectedly higher CPI data next week could limit the extent of rate cuts.
2 Technical Analysis
Daily Chart: Gold closed lower for the first time after seven consecutive days of gains, but this is typically a single-day correction. The 5-day moving average has moved up to the 3550-3545 area, becoming a key support level. As long as gold prices hold this level, the strong unilateral upward trend will remain unchanged.
4-Hour Chart: The middle Bollinger Band (3555 area) provides important support. A break above this level will maintain a relatively strong trend; a break could trigger a periodic pullback.
Technical indicators: The relative strength index (RSI) is in overbought conditions, indicating that there may be a risk of a technical pullback in the short term.
Key Levels:
Resistance: $3,600-3,610 (round-number level + historical high)
Support: $3,570-3,560 (recent swing low), $3,550-3,545 (5-day moving average)
Next Week's Forecast
Based on a comprehensive analysis of fundamentals and technicals, gold is likely to maintain its strong performance next week, but a technical correction is possible. The market will closely watch the CPI data released next week, which will provide more clues on the Fed's policy path.
4. Trading Strategy Recommendations:
Short-term traders can adopt a strategy of "primarily buying on dips, supplemented by selling on rebounds":
Long Opportunities: Consider going long when gold prices stabilize at the 3570-3560 support level, with a target of 3600-3610 and a stop-loss below 3550.
Short Opportunities: Consider going short when gold prices rebound to the 3600-3610 resistance level, with a target of 3580 and a stop-loss above 3620.
Medium- to long-term investors should continue to hold long gold positions, and any technical pullbacks should be considered as opportunities to increase their holdings. The gold bull market is not over, and the possibility of gold reaching a new all-time high in 2025 remains high.
Risk control is crucial:
Avoid excessive leverage.
Set a reasonable stop-loss (exit long positions if the price falls below $3540).
5. Conclusion
The gold market has entered a sensitive zone after reaching a new all-time high. Given the intertwined bullish and bearish factors, be wary of high volatility risks. The overall trend remains bullish, but there may be short-term fluctuations due to technical overbought and high valuations. Any pullback can be seen as a buying opportunity, with a focus on the performance of the 3550-3555 support area.
Trade active
Latest Gold Trend Analysis Strategy:
Trend Analysis Summary
1. Key Drivers (Fundamentals)
Bullish for Gold (Driving the Upward): Market expectations of a Fed rate cut are the most crucial factor currently supporting gold bulls. As long as a rate cut environment exists, gold's overall trend is biased towards an upward trend.
Key Risk Events: Focus on the Fed's interest rate decision on September 17th. This event could be a turning point for the market. The post-decision statement and Fed Chairman Powell's speech will provide clearer guidance on the future policy path, potentially triggering significant market volatility.
2. Technical Analysis - Multi-Level Perspective
Daily Chart (Long-Term Trend):
Trend: A clear bullish trend, trading above a unilaterally rising moving average system.
Signal: Bollinger Bands are opening, and the 5-day and 10-day moving averages are showing strength. Technical patterns support further price increases and a breakout above the 3,600 level.
H4 Chart (4-Hour Chart - Short-Term Trend):
This is a key level for determining short-term strength and weakness.
Bullish Conditions: Price must hold key support levels.
Weakness Signals:
Signal 1: Bollinger Bands begin to close → Indicates weakening upward momentum and a possible period of high-level fluctuations.
Signal 2: A break below key moving average support → May signal a weakening short-term trend.
3. Key Price Levels and Trading Strategies
Upward Resistance:
Short-term strong resistance: 3630-3640. This is the target that the intraday bulls need to conquer. If it breaks through, it will open up greater room for growth.
Downward Support (Critical): The analysis provides multiple lines of defense, increasing in strength from near to far.
The first line of defense (intraday strength/weakness dividing line): 3595-3580. If it falls below this area, the short-term upward momentum will weaken.
The second line of defense (bullish lifeline): 3560 (Friday's breakout point) and 3545-3550 (non-farm payrolls starting point). This is key support to maintain the bullish trend. As long as the price holds above this area, the overall bullish view remains unchanged.
The third line of defense (trend reversal warning line): 3511 (last Thursday’s low) and 3500 (daily top and bottom conversion). If the price falls below 3500, it indicates a potential major reversal in the current uptrend, with the possibility of a deep correction to 3450 or lower.
Trading Strategy:
Primary Strategy: Buy on dips to lower levels. Look for opportunities to buy on dips in the 3560-3595 support area.
Auxiliary strategy: short selling when the price rebounds high is an auxiliary operation idea. If the price rises to the 3630-3640 resistance area and shows signs of obstruction, you can try shorting with a light position, with the target looking at the support below.
Key Point: Avoid chasing gains at high levels; always wait for a pullback before entering the market.
Supplementary Suggestions: Risk management is paramount: At current high levels, volatility is expected to be extremely high. Whether going long or short, stop loss must be set strictly. For long positions, the stop-loss should be set below key support, and for short positions, the stop-loss should be set above key resistance.
Focus on the US Dollar and US Stocks: Gold prices are generally negatively correlated with the US dollar index and sentiment towards risky assets, such as US stocks. Closely monitoring these market movements can help confirm gold's trajectory.
Integrate with real-time news: Technical analysis should be integrated with fundamental news. Beyond the Fed's decision, any unexpected major geopolitical events or unexpectedly strong economic data could instantly shift market trends.
Trade closed: target reached
Will gold experience a technical decline on September 9th?
Detailed Analysis
I. News Analysis (Driving Factors)
Immediate Bullish Factors:
Weak non-farm payroll data: Only 22,000 jobs were added in August, far below expectations, and the previous figure was revised downward to negative, indicating a significant deterioration in the US labor market. This is the most direct driving force for rising gold prices.
Medium-Term Bullish Environment:
Strengthening Expectations of a Fed Rate Cut: The market is pricing in the possibility of a September rate cut, with a higher probability of three cuts before the end of the year. Lower interest rates will weaken the dollar's appeal and push up the price of non-interest-bearing gold.
Future Focus:
This week's US inflation data (CPI): This will provide the next key basis for the Fed's interest rate decision and may set a new direction for gold prices.
II. Technical Analysis
Daily Chart (Determining the Overall Direction):
Trend: A clear unilateral uptrend, with Bollinger Bands opening and the 5- and 10-day moving averages aligned in a bullish pattern, indicating strong momentum. Warning: Despite the bullish trend, it's not advisable to chase the market higher; wait for a pullback before going long.
Key position: It has successfully broken through the 3600 mark and is aiming for higher targets.
H4 Level (4-hour chart - short-term momentum):
Bullish conditions: Price remains above moving average support, and the Bollinger Bands are opening upwards.
Weakness Signals:
Signal 1: Bollinger Bands begin to narrow → indicating a slowdown in upward momentum and a possible period of high-level fluctuations.
Signal 2: A break below moving average support → a deeper pullback may be triggered.
Core Support: 3550 is the weekly strength and weakness dividing line; a break below could lead to a period of fluctuation; 3510 is the trend lifeline; a break below could signal a reversal of the current uptrend.
Intraday Trading Level (Finding Entry and Exit Points):
Upper Resistance: The 3660-3670 area is the short-term target resistance level for the day.
Lower Support (Critical):
First Support (Intraday Strength Line): The 3620-3610 area. This is the top-bottom reversal level following Monday's breakout, serving as the first line of defense to maintain intraday strength.
Second support (key bullish zone): 3595-3580. This is the short-term dividing line between strength and weakness.
Third support (trend core): 3560 (Friday's breakout point) and 3545-3550 (non-farm payroll report starting point). If the price holds above this zone, the bullish pattern remains intact.
Ultimate defense (bull-bear reversal point): A break below the 3510-3500 area would signal a potential fundamental trend shift.
III. Comprehensive Operational Strategy
Main Strategy: Buy on dips
Ideal Long Zone: Enter after stabilization at the 3620-3610 support zone.
Safe Long Zone: A pullback to and stabilization at the 3595-3580 area would be a safer opportunity to add to the long position.
Stop-loss Setting: The stop-loss should be placed below the corresponding support level (for example, if going long at 3620, the stop-loss could be set below 3610). Target: 3660-3670, or even higher.
Secondary Strategy: Sell on Rebound Highs
Opportunities: Only attempt a short position with a small position when the price first touches the strong resistance area of 3660-3670 and a clear resistance signal (such as a long upper shadow or a bearish candlestick pattern) appears.
Attributes: This is a counter-trend operation, which belongs to a short-term pullback. You must enter and exit quickly, and strictly set a stop loss (place the stop loss above 3670).
Summary and Trading Tips
Trend is King: The current market is dominated by bulls, and all operations should prioritize following this primary trend.
Key Levels: 3620-3610 is a key observation point for intraday strength and weakness, while 3560-3550 is the lifeline for whether this week's trend can continue.
Risk Control: Avoid blindly chasing higher prices after a series of sharp gains. Always wait for the price to pull back to support before taking action, and always set a stop-loss to mitigate the risk of a sudden pullback.
❤️Free gold trading signals:t.me/+OJSbWQ6F4KM2Mzk1
💥Gold trading analyst | Technology + logic dual drive
💯Intraday/band strategy analysis | Risk control first, win in stability
💥Gold trading analyst | Technology + logic dual drive
💯Intraday/band strategy analysis | Risk control first, win in stability
Related publications
Disclaimer
The information and publications are not meant to be, and do not constitute, financial, investment, trading, or other types of advice or recommendations supplied or endorsed by TradingView. Read more in the Terms of Use.