🔎 Current Snapshot
Price now: ~$3,684.98 per ounce.
Investing.com
Today’s trading range: ~$3,632.28 → $3,686.33.
Investing.com
Technical indicators (on sites like Investing.com) are showing a Strong Buy bias. Many moving averages & oscillators are in bullish territory.
⚙ Updated Key Levels (Support & Resistance)
Here are revised zones to watch, given the current price:
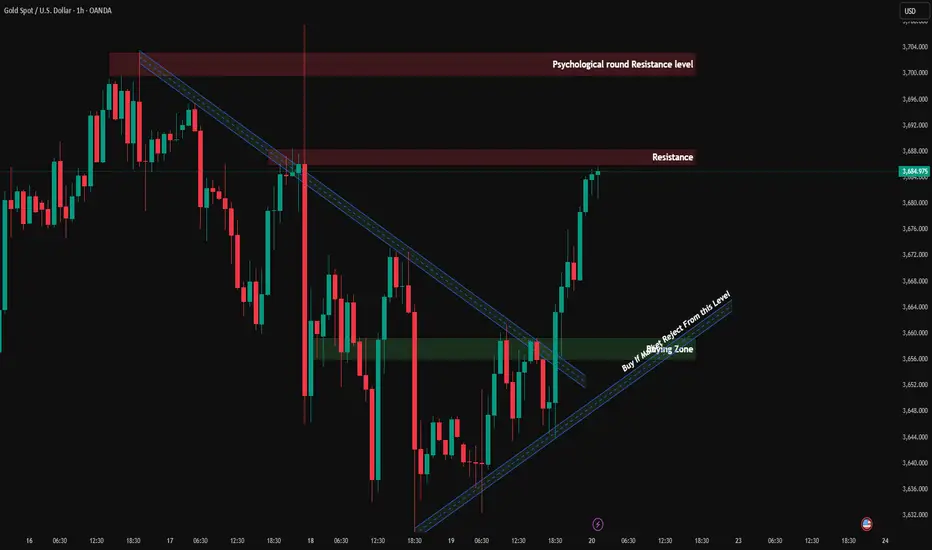
Immediate Resistance - $3700 Psychological round level; has been acting as near-term ceiling.
Immediate Support - $3,650 – $3,670 Zone of recent higher lows; a break below this could see more downside.
Stronger support - $3,600
Major Support Below - $3,500 – $3,550 A deeper correction zone; important in case of more aggressive downward moves.
🔄 Market Structure
Gold is in an uptrend, but there are signs of short-term weakening:
Some indicators are showing overbought conditions.
Price is consolidating just below resistance at ~$3,700 – so momentum is there, but pushing higher might require a catalyst.
On the downside, the structure holds so far — previous swings are supporting, but if support zones (like $3,650) fail, that could shift to a correction mode.
📝 Conclusion
XAU/USD is consolidating within a crucial range, balancing supply and demand forces. The dual-trendline structure signals a potential breakout in the coming sessions. Short-term traders can leverage the 5M CHoCH for early entries, while swing traders should focus on the interplay between the higher timeframe zones and trendlines.
📌 Reminder: Always wait for confirmation before entering trades and manage risk according to your trading plan.
🔔 Follow for updates! Let me know if you have any questions or want to discuss your own analysis. Happy trading! 🚀✨
Price now: ~$3,684.98 per ounce.
Investing.com
Today’s trading range: ~$3,632.28 → $3,686.33.
Investing.com
Technical indicators (on sites like Investing.com) are showing a Strong Buy bias. Many moving averages & oscillators are in bullish territory.
⚙ Updated Key Levels (Support & Resistance)
Here are revised zones to watch, given the current price:
Immediate Resistance - $3700 Psychological round level; has been acting as near-term ceiling.
Immediate Support - $3,650 – $3,670 Zone of recent higher lows; a break below this could see more downside.
Stronger support - $3,600
Major Support Below - $3,500 – $3,550 A deeper correction zone; important in case of more aggressive downward moves.
🔄 Market Structure
Gold is in an uptrend, but there are signs of short-term weakening:
Some indicators are showing overbought conditions.
Price is consolidating just below resistance at ~$3,700 – so momentum is there, but pushing higher might require a catalyst.
On the downside, the structure holds so far — previous swings are supporting, but if support zones (like $3,650) fail, that could shift to a correction mode.
📝 Conclusion
XAU/USD is consolidating within a crucial range, balancing supply and demand forces. The dual-trendline structure signals a potential breakout in the coming sessions. Short-term traders can leverage the 5M CHoCH for early entries, while swing traders should focus on the interplay between the higher timeframe zones and trendlines.
📌 Reminder: Always wait for confirmation before entering trades and manage risk according to your trading plan.
🔔 Follow for updates! Let me know if you have any questions or want to discuss your own analysis. Happy trading! 🚀✨
Disclaimer
The information and publications are not meant to be, and do not constitute, financial, investment, trading, or other types of advice or recommendations supplied or endorsed by TradingView. Read more in the Terms of Use.
Disclaimer
The information and publications are not meant to be, and do not constitute, financial, investment, trading, or other types of advice or recommendations supplied or endorsed by TradingView. Read more in the Terms of Use.