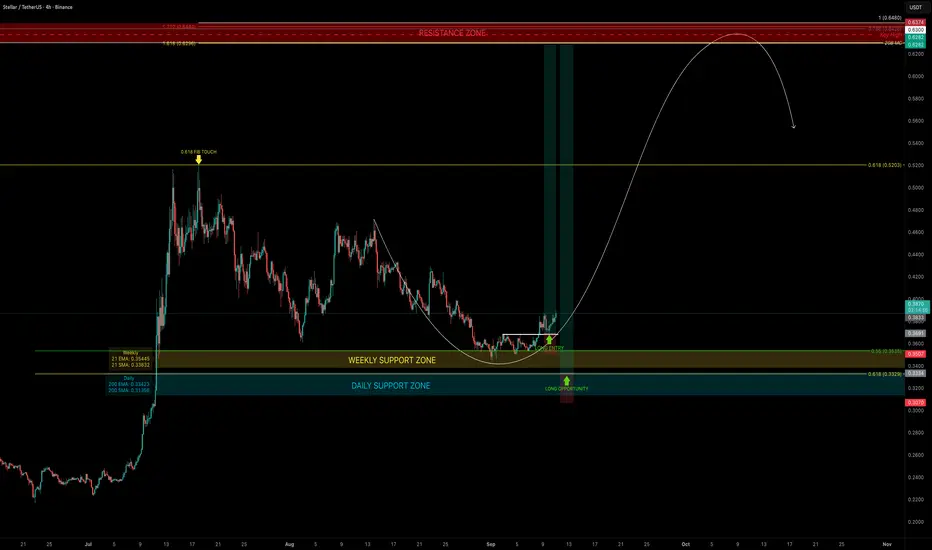
XLM recently found support at the 0.55 Fib retracement, in confluence with the 21 EMA/SMA on the weekly timeframe, triggering a bounce. The ideal 0.618 long entry unfortunately did not come into play.
Support Confluence
This cluster around $0.35–$0.31 forms a strong dynamic support zone and a great range for DCA laddering.
Resistance Confluence (Take Profit Zone $0.63–$0.65)
Together, these create a stacked resistance cluster between $0.63–$0.65 → ideal take-profit zone and potential short setup.
🟢 Trade Plan
Technical Insight
Key Levels to Watch
🔍 Indicators used
➡️ Available for free. You can find it on my profile under “Scripts” and apply it directly to your charts for extra confluence when planning your trades.
_________________________________
💬 If you found this helpful, drop a like and comment!
Support Confluence
- 21 EMA (weekly): $0.3536
- 21 SMA (weekly): $0.3384
- 200 EMA (daily): $0.33425
- 200 SMA (daily): $0.3136
This cluster around $0.35–$0.31 forms a strong dynamic support zone and a great range for DCA laddering.
Resistance Confluence (Take Profit Zone $0.63–$0.65)
- 20B Market Cap Resistance: ~$0.63
- Key High (Buy-Side Liquidity): $0.6374
- 0.786 Fib retracement: $0.6426
- 1.0 Trend-Based Fib Extension: $0.648
- 1.618 Fib Extension: $0.6296
Together, these create a stacked resistance cluster between $0.63–$0.65 → ideal take-profit zone and potential short setup.
🟢 Trade Plan
- Best Entry: Laddering (DCA) from current levels down toward $0.31
- Stop-Loss: Flexible depending on DCA strategy, clear invalidation below $0.31
- Target (TP Zone): $0.63–$0.65
Technical Insight
- The bounce from the 0.55 Fib retracement + weekly 21 EMA/SMA shows bulls defending this zone.
- With strong dynamic support below and a stacked resistance confluence cluster at $0.63–$0.65, XLM may be setting up for a 70%+ rally.
- DCA remains the best approach, as laddering down toward $0.31 allows flexible positioning.
Key Levels to Watch
- Support: $0.35–$0.31 (EMA/SMA cluster, DCA zone)
- Resistance / TP: $0.63–$0.65 (Fib, extensions, market cap confluence)
🔍 Indicators used
- Multi Timeframe 8x MA Support Resistance Zones [SiDec] → to identify support and resistance zones such as the weekly 21 EMA/SMA.
➡️ Available for free. You can find it on my profile under “Scripts” and apply it directly to your charts for extra confluence when planning your trades.
_________________________________
💬 If you found this helpful, drop a like and comment!
Note
Setup remains valid. The high-probability long entry is sitting at the 0.618 fib retracement ($0.3329)🏆 Mastering Fibonacci for precision trading
🔹 Sharing high-probability trade setups
⚡ Unlock the power of technical analysis!
🔹 Sharing high-probability trade setups
⚡ Unlock the power of technical analysis!
Related publications
Disclaimer
The information and publications are not meant to be, and do not constitute, financial, investment, trading, or other types of advice or recommendations supplied or endorsed by TradingView. Read more in the Terms of Use.
🏆 Mastering Fibonacci for precision trading
🔹 Sharing high-probability trade setups
⚡ Unlock the power of technical analysis!
🔹 Sharing high-probability trade setups
⚡ Unlock the power of technical analysis!
Related publications
Disclaimer
The information and publications are not meant to be, and do not constitute, financial, investment, trading, or other types of advice or recommendations supplied or endorsed by TradingView. Read more in the Terms of Use.