Natural gas markets are influenced by a complex interplay of supply, demand, weather, geopolitical events, and technical factors. Below is a concise analysis based on recent trends and data as of August 24, 2025, covering key aspects of the natural gas market
Price Trends and Market Dynamics
Spot and Futures Prices: The Henry Hub spot price recently fell from $2.92/MMBtu to $2.81/MMBtu, and the September 2025 NYMEX futures contract dropped from $2.828/MMBtu to $2.752/MMBtu. The 12-month futures strip (September 2025–August 2026) averaged $3.501/MMBtu, reflecting a bearish near-term outlook but expectations of tighter balances later.
Supply and DemandSupply: U.S. natural gas production has risen, with a 3% increase in marketed production in 2025, particularly from the Permian (2 Bcf/d), Haynesville, and Appalachia (0.9 Bcf/d each). However, production is expected to stabilize in 2026 as associated gas from oil declines.
Storage: U.S. storage inventories are projected to reach 3,927 Bcf by October 31, 2025, 174 Bcf above the five-year average, due to higher-than-average injections (20% above the five-year average). This surplus is pressuring prices downward.
Demand: Cool weather forecasts for August 2025, potentially the coolest in 50 years, have reduced demand, contributing to bearish price sentiment. However, LNG exports are rebounding, with Freeport LNG operations resuming, providing some support.
LNG Exports: Maintenance at U.S. LNG terminals earlier in 2025 reduced exports, but recovery and new contracts (e.g., ConocoPhillips’ 4 Mt/y from Port Arthur LNG Phase 2) signal growing export potential.
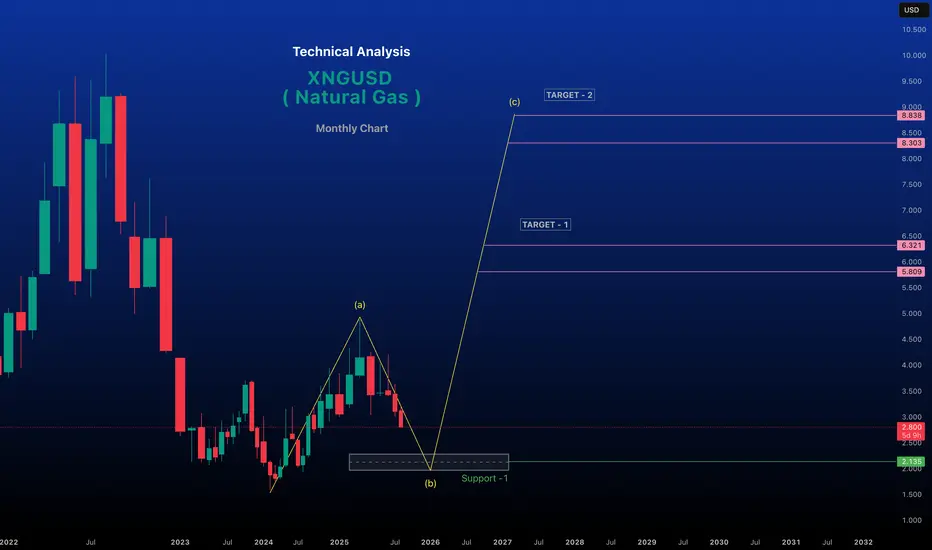
Technical AnalysisBearish Signals: Technical indicators suggest a "strong sell" for Natural Gas Futures across multiple timeframes (daily, weekly, monthly), driven by a head-and-shoulders pattern with prices breaking below the $3.050 neckline, targeting $2.220–$2.000.
Indicators: RSI, MACD, and stochastic oscillators indicate oversold conditions, but negative momentum persists below key resistance levels like $3.100–$3.320. Pivot points and moving averages reinforce bearish trends, with potential support at $2.200.
Geopolitical and Structural FactorsEurope: The 2022–2023 Russian supply shock shifted Europe to rely on LNG, increasing price volatility. Market reforms have boosted trading volumes (7,300 bcm in 2024, 15x demand), but derivatives trading by physical players dominates, limiting speculative impacts.
Weather Impact: Cooling in the Midwest and Northeast (highs of 60s–80s°F) contrasts with hotter conditions elsewhere (80s–100s°F), driving regional demand differences. Weather models (ECMWF, GFS) forecast continued impacts on heating and cooling degree days, affecting prices.
Energy Transition: Natural gas is increasingly vital for electricity generation as coal phases out, linking gas and power markets and amplifying price sensitivity to weather and demand.
Forecast and OutlookShort-Term (1–6 Weeks): Bearish due to high storage, weak demand from cool weather, and technical indicators. Prices may test support at $2.220–$2.080,
Long-Term: Growing U.S. electricity demand (31% over 15 years) and constrained global supply (e.g., limited OPEC spare capacity) suggest bullish prospects for natural gas as a reliable fuel.
Trading ConsiderationsRisks: High volatility, weather-driven demand shifts, and geopolitical uncertainties (e.g., Russia-Ukraine tensions) pose risks.
Strategies: Traders may consider short positions targeting $2.80, but oversold conditions suggest caution for potential reversals. Long-term investors might accumulate near support zones ($2.220–$2.080) for 2026 upside.
Data Tools: Monitor EIA storage reports, weather forecasts (NatGasWeather.com), and technical indicators (RSI, MACD) for real-time insights.
Note: Trading involves high risks, and past performance does not guarantee future results. Always conduct your own research.
Price Trends and Market Dynamics
Spot and Futures Prices: The Henry Hub spot price recently fell from $2.92/MMBtu to $2.81/MMBtu, and the September 2025 NYMEX futures contract dropped from $2.828/MMBtu to $2.752/MMBtu. The 12-month futures strip (September 2025–August 2026) averaged $3.501/MMBtu, reflecting a bearish near-term outlook but expectations of tighter balances later.
Supply and DemandSupply: U.S. natural gas production has risen, with a 3% increase in marketed production in 2025, particularly from the Permian (2 Bcf/d), Haynesville, and Appalachia (0.9 Bcf/d each). However, production is expected to stabilize in 2026 as associated gas from oil declines.
Storage: U.S. storage inventories are projected to reach 3,927 Bcf by October 31, 2025, 174 Bcf above the five-year average, due to higher-than-average injections (20% above the five-year average). This surplus is pressuring prices downward.
Demand: Cool weather forecasts for August 2025, potentially the coolest in 50 years, have reduced demand, contributing to bearish price sentiment. However, LNG exports are rebounding, with Freeport LNG operations resuming, providing some support.
LNG Exports: Maintenance at U.S. LNG terminals earlier in 2025 reduced exports, but recovery and new contracts (e.g., ConocoPhillips’ 4 Mt/y from Port Arthur LNG Phase 2) signal growing export potential.
Technical AnalysisBearish Signals: Technical indicators suggest a "strong sell" for Natural Gas Futures across multiple timeframes (daily, weekly, monthly), driven by a head-and-shoulders pattern with prices breaking below the $3.050 neckline, targeting $2.220–$2.000.
Indicators: RSI, MACD, and stochastic oscillators indicate oversold conditions, but negative momentum persists below key resistance levels like $3.100–$3.320. Pivot points and moving averages reinforce bearish trends, with potential support at $2.200.
Geopolitical and Structural FactorsEurope: The 2022–2023 Russian supply shock shifted Europe to rely on LNG, increasing price volatility. Market reforms have boosted trading volumes (7,300 bcm in 2024, 15x demand), but derivatives trading by physical players dominates, limiting speculative impacts.
Weather Impact: Cooling in the Midwest and Northeast (highs of 60s–80s°F) contrasts with hotter conditions elsewhere (80s–100s°F), driving regional demand differences. Weather models (ECMWF, GFS) forecast continued impacts on heating and cooling degree days, affecting prices.
Energy Transition: Natural gas is increasingly vital for electricity generation as coal phases out, linking gas and power markets and amplifying price sensitivity to weather and demand.
Forecast and OutlookShort-Term (1–6 Weeks): Bearish due to high storage, weak demand from cool weather, and technical indicators. Prices may test support at $2.220–$2.080,
Long-Term: Growing U.S. electricity demand (31% over 15 years) and constrained global supply (e.g., limited OPEC spare capacity) suggest bullish prospects for natural gas as a reliable fuel.
Trading ConsiderationsRisks: High volatility, weather-driven demand shifts, and geopolitical uncertainties (e.g., Russia-Ukraine tensions) pose risks.
Strategies: Traders may consider short positions targeting $2.80, but oversold conditions suggest caution for potential reversals. Long-term investors might accumulate near support zones ($2.220–$2.080) for 2026 upside.
Data Tools: Monitor EIA storage reports, weather forecasts (NatGasWeather.com), and technical indicators (RSI, MACD) for real-time insights.
Note: Trading involves high risks, and past performance does not guarantee future results. Always conduct your own research.
renderwithme
Disclaimer
The information and publications are not meant to be, and do not constitute, financial, investment, trading, or other types of advice or recommendations supplied or endorsed by TradingView. Read more in the Terms of Use.
renderwithme
Disclaimer
The information and publications are not meant to be, and do not constitute, financial, investment, trading, or other types of advice or recommendations supplied or endorsed by TradingView. Read more in the Terms of Use.