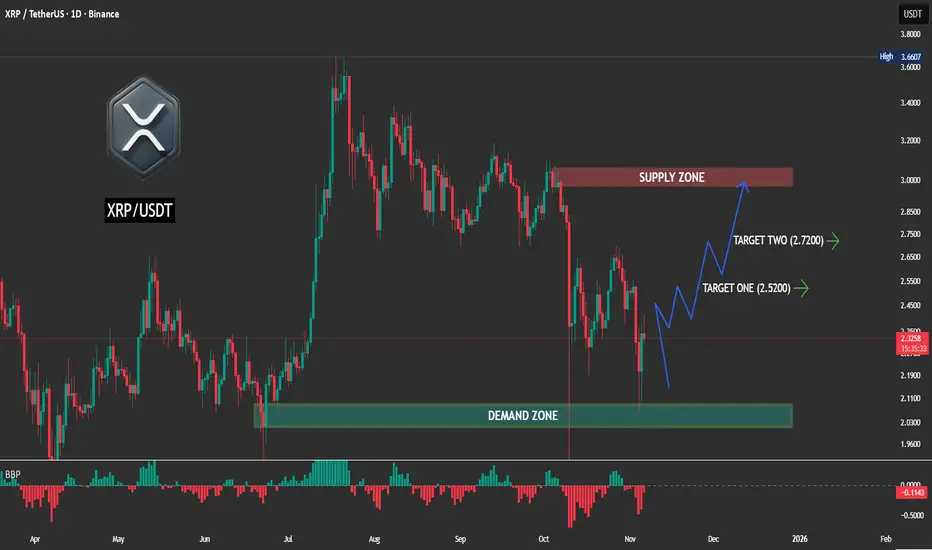
Pattern: Demand Zone Rebound (Bullish Recovery Setup)
The chart shows XRP bouncing from a strong demand zone, signaling a potential short-term reversal after recent selling pressure. The price action suggests that buyers are gradually regaining control, with momentum shifting upward toward key resistance levels.
Key Observations
🔹 Demand Zone: Around $2.10 – $2.20, acting as strong accumulation support where buyers previously stepped in.
🔹 Immediate Resistance: Supply zone near $2.90 – $3.00, expected to be the next major barrier.
🔹 Targets:
🎯 Target 1: $2.52 — first resistance test after bounce.
🎯 Target 2: $2.72 — extension move toward supply zone.
🔹 Bull Bear Power (BBP): Currently improving from the negative region (-0.11), suggesting weakening bearish strength and a potential bullish transition.
🔹 Structure: Price forming higher lows after a deep retracement, indicating renewed accumulation and possible trend reversal setup.
Potential Move
If XRP sustains above $2.20, bullish momentum could drive a move toward the $2.50 – $2.70 range.
Failure to hold this demand zone, however, may trigger a retest toward $2.00 support.
Summary:
XRP is showing early signs of a bullish reversal from a major demand zone. Momentum indicators hint at a possible shift toward the upside, with targets near $2.52 and $2.72 if buyers maintain control.
#coinpediamarkets #XRP #Ripple #XRPUSDT #CryptoAnalysis #TechnicalAnalysis #CryptoTraders #CryptoMarket
Disclaimer
The information and publications are not meant to be, and do not constitute, financial, investment, trading, or other types of advice or recommendations supplied or endorsed by TradingView. Read more in the Terms of Use.
Disclaimer
The information and publications are not meant to be, and do not constitute, financial, investment, trading, or other types of advice or recommendations supplied or endorsed by TradingView. Read more in the Terms of Use.