✅ Key Technical Levels & Indicators
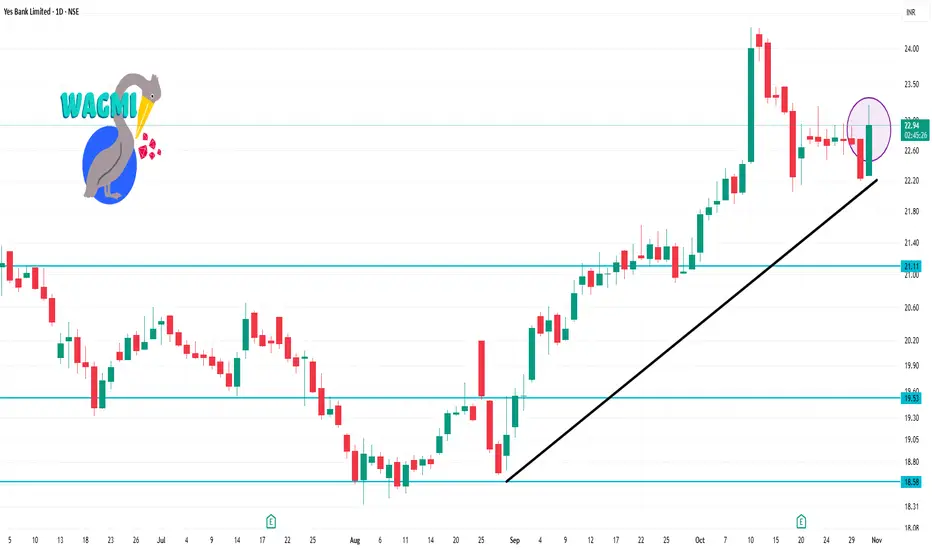
Recent price around ₹22.60–₹22.70.
Support zones: ~ ₹22.22 (short term) and ~ ₹20.97 (medium term) according to MarketScreener.
Resistance: ~ ₹24.03 region.
Pivot (classic) for the day: ~ ₹22.58.
Daily technical indicator summary: Many moving averages show bullish (price above SMA/EMA) for 20/50/200 day on some sites.
Oscillators: RSI in mid-range (~46.6) signalling neither strongly overbought nor oversold.
Short-term trend: Many tools flag “bullish” in short, medium and long term.
Related publications
Disclaimer
The information and publications are not meant to be, and do not constitute, financial, investment, trading, or other types of advice or recommendations supplied or endorsed by TradingView. Read more in the Terms of Use.
Related publications
Disclaimer
The information and publications are not meant to be, and do not constitute, financial, investment, trading, or other types of advice or recommendations supplied or endorsed by TradingView. Read more in the Terms of Use.