🔎 Pattern Analysis
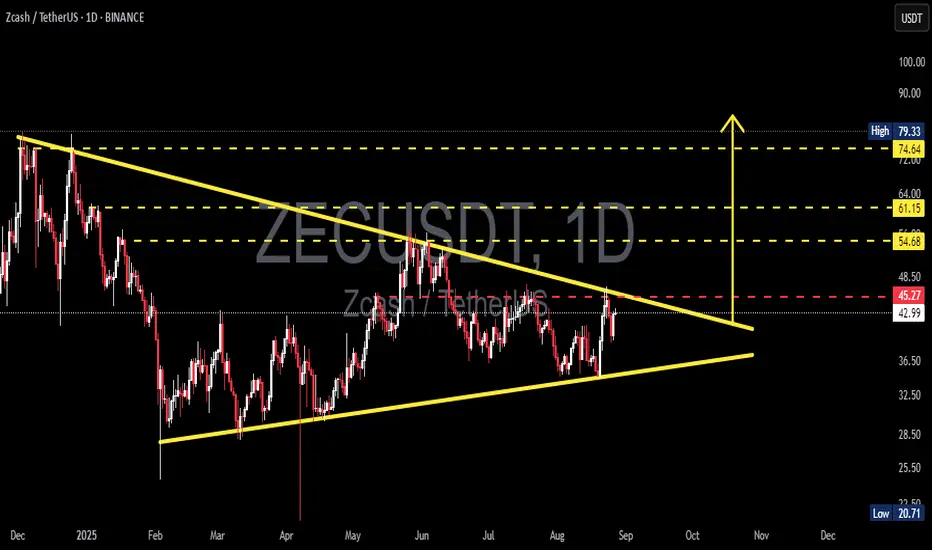
On the daily chart, ZEC/USDT is forming a symmetrical triangle. This structure is characterized by:
Lower Highs → sellers continue to defend lower levels (descending resistance).
Higher Lows → buyers step in earlier each time (ascending support).
Both lines are converging, compressing volatility, and signaling that a major move is imminent. The apex of this triangle is projected around late September to early October 2025, meaning a breakout (up or down) is likely to occur before then.
---
📈 Bullish Scenario (Upside Breakout)
If ZEC manages to break and close above 45–48 (red dashed line + descending resistance), especially with rising volume, it would confirm a bullish breakout.
➡️ Potential upside targets:
🎯 Target 1: 54.68 (+27%)
🎯 Target 2: 61.15 (+42%)
🎯 Target 3: 74.64 (+73%)
Such a breakout often sparks sustained rallies, especially if the broader crypto market sentiment aligns.
---
📉 Bearish Scenario (Downside Breakdown)
If ZEC fails to break resistance and instead closes below ~36.50 (ascending support), downside momentum could accelerate.
➡️ Potential downside targets:
🎯 Target 1: 36.50 (first support, −15%)
🎯 Target 2: 32.50 (major support, −24%)
🎯 Target 3: 20.71 (historical low, −52%)
This would indicate weakness and could open the door for deeper declines toward multi-month lows.
---
⚖️ Key Takeaways
The symmetrical triangle is a neutral but powerful pattern → direction will depend on the breakout.
Always wait for confirmation (daily close + volume spike) before committing.
Beware of false breakouts — a retest of the breakout zone is often a safer entry.
Risk management is crucial: protect capital with stop-loss and proper position sizing.
👉 In short: ZEC is approaching a make-or-break moment. Breakout to the upside could fuel a strong rally, while a breakdown could trigger heavy selling pressure.
#ZECUSDT #Zcash #CryptoAnalysis #Breakout #SymmetricalTriangle #Altcoins #TechnicalAnalysis #PriceAction
✅ Get Free Signals! Join Our Telegram Channel Here: t.me/TheCryptoNuclear
✅ Twitter: twitter.com/crypto_nuclear
✅ Join Bybit : partner.bybit.com/b/nuclearvip
✅ Benefits : Lifetime Trading Fee Discount -50%
✅ Twitter: twitter.com/crypto_nuclear
✅ Join Bybit : partner.bybit.com/b/nuclearvip
✅ Benefits : Lifetime Trading Fee Discount -50%
Disclaimer
The information and publications are not meant to be, and do not constitute, financial, investment, trading, or other types of advice or recommendations supplied or endorsed by TradingView. Read more in the Terms of Use.