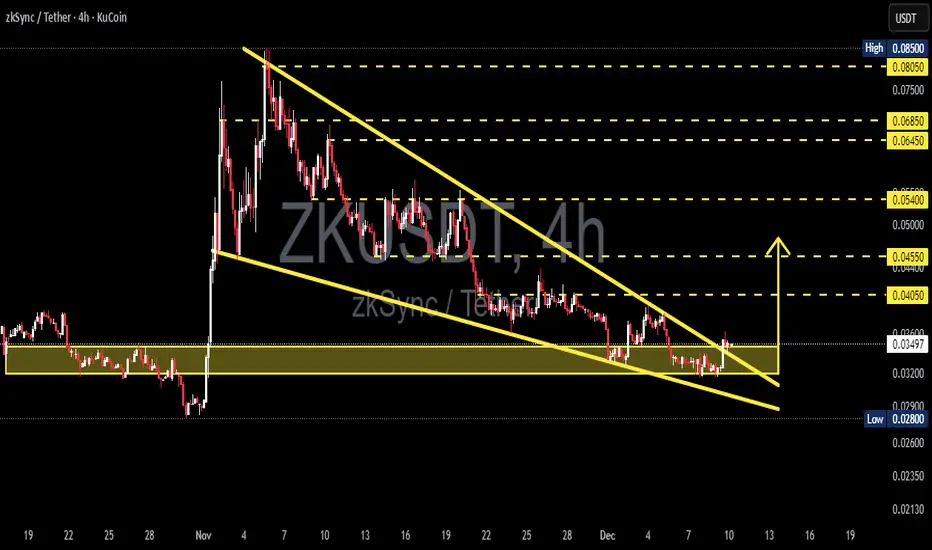
ZK/USDT is entering a critical phase after a prolonged decline since early November. Price is now holding right above the 0.0347–0.0320 demand zone, the same area that previously triggered a strong bullish reaction. At the same time, sellers have been compressing price into a falling wedge structure, a pattern that historically carries a high probability of triggering major trend reversals.
This narrowing wedge signals that volatility is being compressed to its maximum point. The tighter the structure becomes, the stronger the potential breakout. If buyers manage to break above the upper wedge trendline, ZK may release weeks of accumulated bearish pressure and shift into a new bullish phase.
But this demand zone is also the bulls’ final line of defense. A clean breakdown below 0.0320 would invalidate the structure and open the door for deeper downside toward previous lows.
---
Bullish Scenario (High Probability Reversal if Confirmed)
Bullish confirmation checklist:
1. A strong 4H candle closes above the upper wedge.
2. A successful retest of the trendline as new support.
3. Increased volume on the breakout (momentum confirmation).
If confirmed, ZK’s upside potential opens toward:
Target 1: 0.0405
Target 2: 0.0455
Target 3: 0.0540
Major extension: 0.0645 – 0.0685
This structure often appears just before mid-trend to major reversals.
---
Bearish Scenario (Trend Continuation if Support Fails)
Bearish confirmation checklist:
1. Price rejects the upper wedge and loses upward momentum.
2. A decisive 4H close below 0.0320.
3. Retest of 0.0320 acting as new resistance.
Downside targets if breakdown occurs:
Target 1: 0.0280
Target 2: 0.021–0.023 if bearish momentum accelerates.
A breakdown at this zone would re-establish a deeper bearish structure with new lower lows.
---
Why This Zone Matters
1. The 0.0347–0.0320 demand zone has acted as a strong accumulation area before.
2. Falling wedges are often used by smart money as a transition pattern from distribution to accumulation.
3. Extended consolidation at support usually precedes large directional moves.
4. Low-volume dips into demand often indicate the final phase before reversal.
This makes the current price zone not just a support level, but a decision point for the next major trend.
#ZKSync #ZKUSDT #CryptoAnalysis #PriceAction #FallingWedge #DemandZone #BreakoutSetup #CryptoTrading #AltcoinAnalysis
✅ Get Free Signals! Join Our Telegram Channel Here: t.me/TheCryptoNuclear
✅ Twitter: twitter.com/crypto_nuclear
✅ Join Bybit : partner.bybit.com/b/nuclearvip
✅ Benefits : Lifetime Trading Fee Discount -50%
✅ Twitter: twitter.com/crypto_nuclear
✅ Join Bybit : partner.bybit.com/b/nuclearvip
✅ Benefits : Lifetime Trading Fee Discount -50%
Disclaimer
The information and publications are not meant to be, and do not constitute, financial, investment, trading, or other types of advice or recommendations supplied or endorsed by TradingView. Read more in the Terms of Use.