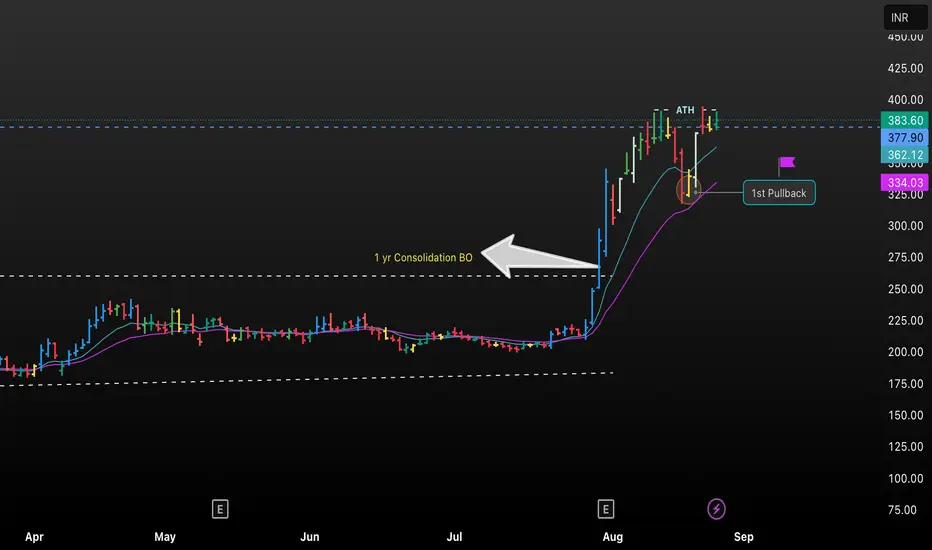
This chart for Zuari spotlights a classic technical breakout after a one-year consolidation phase, followed by a textbook first pullback. The consolidation breakout (BO) led to a powerful price surge, establishing an all-time high (ATH) and setting up a potential swing trade opportunity. Learn to spot breakout structures, pullback setups, and use moving averages for actionable entries in Indian stocks. Ideal for swing traders and technical analysts looking to master breakout and pullback strategies with real chart examples.
These suggestions are tailored to boost engagement for educational trading content and will appeal to your target audience interested in technical analysis and actionable setups.
These suggestions are tailored to boost engagement for educational trading content and will appeal to your target audience interested in technical analysis and actionable setups.
Disclaimer
The information and publications are not meant to be, and do not constitute, financial, investment, trading, or other types of advice or recommendations supplied or endorsed by TradingView. Read more in the Terms of Use.
Disclaimer
The information and publications are not meant to be, and do not constitute, financial, investment, trading, or other types of advice or recommendations supplied or endorsed by TradingView. Read more in the Terms of Use.