Part 1 Institutional vs. Technical Key Option Terminologies
1. Strike Price
The agreed price at which the asset can be bought or sold.
2. Expiry Date
The last date on which the option contract is valid.
3. Premium
The price paid by the option buyer to the seller.
4. Lot Size
The fixed quantity of underlying assets per option contract.
5. Open Interest (OI)
Total number of outstanding option contracts.
Community ideas

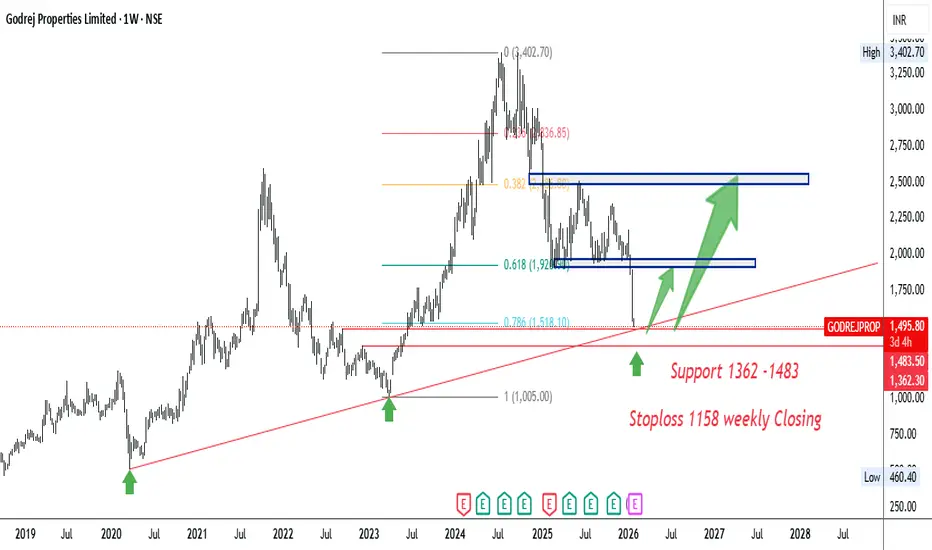
Positional Buy Godrej Properties.Buy Godrej Properties
Strong Retest Support of 1362-1483.
+
Trendline Support
+
Fibo 78.6 Support.
Stoploss 1158 weekly Closing.
Target should be 1900 and 2500
AXISBANK 40% upside possibility in 1-1.5 YearsAXISBANK 40% upside possibility in 1-1.5 Years
Fundamentals - Company has delivered good profit growth of 72.2% CAGR over last 5 years - Best among all Private banks.
Technical - Stock breaking from ATH backed with excellent Results.
LTP - 1325
Targets - 1850+
Timeframe - 1-1.5 Years.
Happy Investing.

4H Rejection Block & Return to EquilibriumGold (XAUUSD) has rallied aggressively but is now showing signs of exhaustion as it taps into the supply zone around the 5080-5100 level. We are seeing a rejection on the 4H timeframe, suggesting a potential shift in momentum.

Gold 5200/1h ChartGold moving in channel from last 10 days. I believe breaking the 5110 level will put gold to new high of 5200. Although I don't see this happing today. Failing to do so might trigger a profit booking as it has already moved 15% from previous high (+last 7 days green candle closing).
Be vigilant with SL, and don't go all in.

Elliott Wave Analysis – XAUUSD | 27/01/2026
1. Momentum
Daily (D1)
– D1 momentum is currently compressing. This indicates that bullish pressure is still present; however, momentum has weakened, so a potential reversal risk exists.
→ The broader trend remains bullish, but strong corrective moves should be treated with caution.
H4
– H4 momentum is currently in the oversold zone.
→ This suggests that H4 is likely preparing to form a base and initiate a bullish reversal in the near term.
H1
– H1 momentum is currently declining.
→ In the short term, H1 may continue to correct for several more H1 candles before completing the pullback.
2. Wave Structure
Daily (D1) Wave Structure
– On the daily timeframe, price remains within a 5-wave structure (1–2–3–4–5) marked in blue.
– At this stage, blue wave 5 is extending, making it very difficult to precisely identify the termination point.
– In Elliott Wave theory, extensions reflect extreme bullish sentiment.
– When market psychology normalizes, the corrective move that follows is often sharp and aggressive.
→ Therefore, the current phase of XAUUSD requires a high level of caution.
H4 Wave Structure
– The corrective structure on H4 is expanding and developing multiple internal sub-structures.
→ As a result, accurate wave identification is not feasible until the structure is fully completed.
– For now, we rely on two key principles to define observation zones:
– Waves of the same degree often show similarities in time and price length.
– Waves within a structure typically maintain Fibonacci relationships with one another.
– Based on these principles, I am temporarily labeling a 1–2–3–4–5 structure in yellow on the H4 timeframe for monitoring purposes.
– Up to this point, the H4 correction remains consistent with the internal corrective waves within yellow wave 3.
H4 Scenario Monitoring
– If H4 momentum reverses upward and price breaks above the previous high, the market is likely still within yellow wave 3.
– Conversely, if the upcoming H4 rally fails to produce a new high, the probability increases that price is transitioning into yellow wave 4.
H1 Wave Structure
– On the H1 timeframe, an ABC structure has formed, and price is currently in a corrective rebound.
– However, at the present moment:
– H1 momentum has already turned bearish
– Price has failed to create a new high
→ Therefore, no immediate entry is warranted. We should wait for:
– H1 momentum to decline into the oversold zone
– At that point, a Buy setup can be considered based on:
– The ABC corrective structure on H1
– Alignment with the anticipated bullish reversal in H4 momentum
3. Target Zone
– A Fibonacci confluence zone from multiple waves is located around the 4957 price area.
→ This zone is considered the potential termination area for the current H1 correction.
– Regarding profit targets:
– We will continue monitoring subsequent momentum reversals on H1 and H4
– Once bullish momentum is confirmed, trade management will be handled in phases.
4. Trading Plan
– Buy Setup Zone: 4958 – 4955
– Stop Loss: 4937
– Take Profit Levels:
– TP1: 4978
– TP2: 5021
– TP3: 5060

HDFCBANK Lead the Pre-Budget Rally - Lead Turnover Stock HDFCBANK Lead Turnover Stock Level analysis for 28th JAN 2026
Lead the Pre-Budget Rally.
👇🏼Screenshot: All-day (27th Jan 2026) in 5 min TF..
💥Level Interpretation / description:
L#1: If the candle crossed & stays above the “Buy Gen”, it is treated / considered as Bullish bias.
L#2: Possibility / Probability of REVERSAL near RLB#1 & UBTgt
L#3: If the candle stays above “Sell Gen” but below “Buy Gen”, it is treated / considered as Sidewise. Aggressive Traders can take Long position near “Sell Gen” either retesting or crossed from Below & vice-versa i.e. can take Short position near “Buy Gen” either retesting or crossed downward from Above.
L#4: If the candle crossed & stays below the “Sell Gen”, it is treated / considered a Bearish bias.
L#5: Possibility / Probability of REVERSAL near RLS#1 & USTgt
HZB (Buy side) & HZS (Sell side) => Hurdle Zone,
*** Specialty of “HZB#1, HZB#2 HZS#1 & HZS#2” is Sidewise (behaviour in Nature)
Rest Plotted and Mentioned on Chart
Color code Used:
Green =. Positive bias.
Red =. Negative bias.
RED in Between Green means Trend Finder / Momentum Change
/ CYCLE Change and Vice Versa.
Notice One thing: HOW LEVELS are Working.
Use any Momentum Indicator / Oscillator or as you "USED to" to Take entry.
━━━━━━━━━━━━━━━━━━━━━━━━━━━━━━━━━━━━━━━━━━━
⚠️ DISCLAIMER:
The information, views, and ideas shared here are purely for educational and informational purposes only. They are not intended as investment advice or a recommendation to buy, sell, or hold any financial instruments. I am not a SEBI-registered financial adviser.
Trading and investing in the stock market involves risk, and you should do your own research and analysis. You are solely responsible for any decisions made based on this research.
"As HARD EARNED MONEY IS YOUR's, So DECISION SHOULD HAVE TO BE YOUR's".
━━━━━━━━━━━━━━━━━━━━━━━━━━━━━━━━━
❇️ Follow notification about periodical View
💥 Do Comment for Stock WEEKLY Level Analysis.🚀
📊 Do you agree with this view?
✈️ HIT THE PLANE ICON if this technical observation resonates with you. It will Motivate me.
━━━━━━━━━━━━━━━━━━━━━━━━━━━━━━━━━
💡 If You LOOKING any CHART & want for Level and ANALYZE?
Share your desired stock names in the comments below! I will try to analyze the chart Levels, patterns and share my technical view (so far my Knowledge).
If Viewers think It can identify meaningful setups. Looking forward to hearing from all of you — let's keep this discussion going and help each other make better trading decisions.

Hindalco Industries Ltd Stock price will hit 1020-1035Hindalco Industries Ltd is well-positioned for a short-term long trade at ₹962, supported by favorable price and volume action. The setup indicates upside potential toward the ₹1,020–1,035 zone in the near term, making current levels an attractive entry for short-term traders.

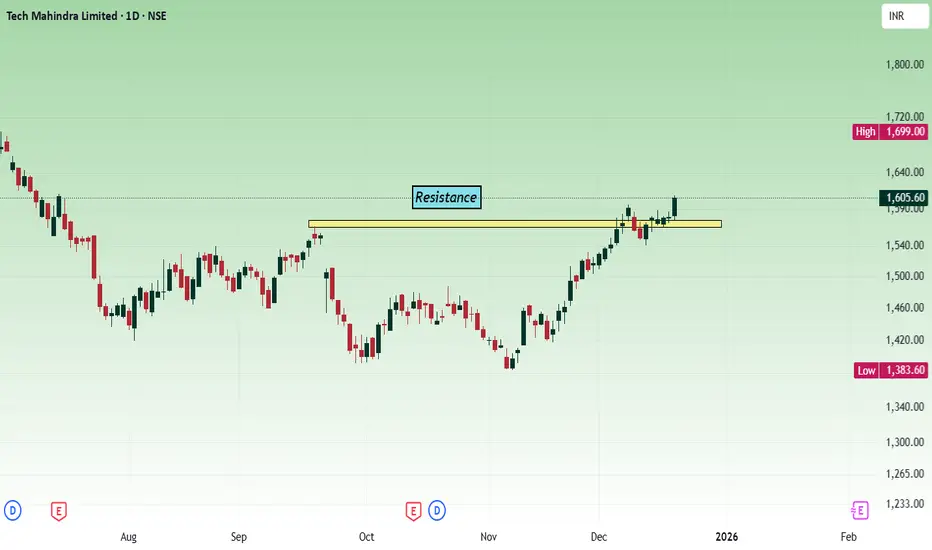
TechM - Multi time frame analysisThe price has broken the resistance at the 1560 - 1580 zone, unable to sustain, fall back and once again took support. Today's movement shows bullish strength.
As per the daily chart, the price has broken the trend line. Strong weekly close will confirm the bullish movement.
Buy above the 1595 - 1602 zone with the stop loss of 1580 for the targets 1616, 1630, 1648 and 1662. This analysis is for the short term.
Price should show bullish strength at the 1580 - 1600 zone. Watch how the price is showing the strength before taking any trade.
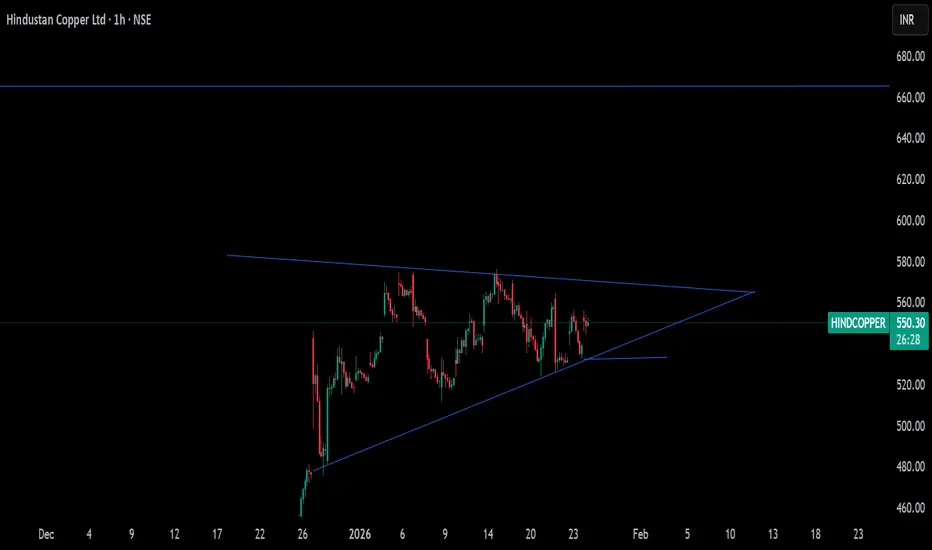
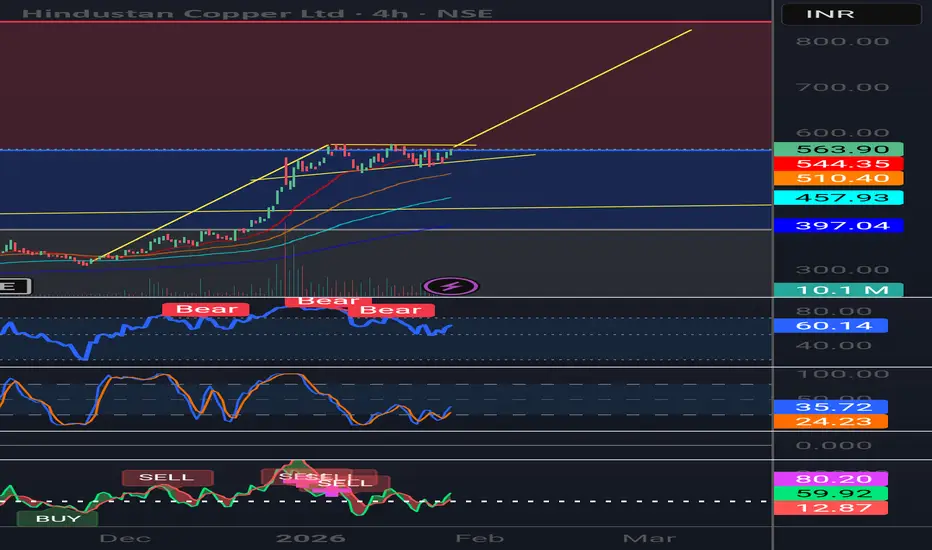
HindCopper to test ATH!!Nifty Metals are in a cyclical bull run. HindCopper has taken a perfect support in a bullish channel. One can plan a long position with an SL below the channel, targetting ATH levels of 670.
XAUUSD SELLAccording to the current conditions, gold may fall downwards. You can short gold after receiving LTF confirmation. People have bought it in a hurry, and gold will only make a new ATH after their stop losses are taken. What I'm saying isn't 100% accurate, but I'm sharing my experience. You should choose the trade based on your risk appetite.

Bullish pennant HindCopperStrong uptrend. Price is consolidating just below resistance (~₹565–570). This looks like a healthy pause after a sharp rally. Expectation: a breakout above ₹570 can lead to a fast move higher; downside remains limited as long as ~₹545 holds.
Next possible targets (on upside):
₹620–630 → first immediate target after breakout
₹650 → next resistance / partial profit zone
₹700–720 → measured move if momentum sustains
Final target 820
Key condition: these come into play only if price sustains above ~₹570.
MAJOR INDEX OUTLOOK | NASDAQ (US100) Market Structure Update Global indices are currently approaching critical decision zones, and NASDAQ (US100) is showing a
notable shift in short-term market sentiment.
After a prolonged corrective phase, the H1 time frame now confirms a bullish structural transition —
price is forming Higher Highs and Higher Lows, indicating that buyers are gaining short-term control.
However, the index is now testing a major resistance zone near 26,000 — a psychological level combined
with historical supply pressure.
This is a decisive area.
Key Technical Levels
🔺 Major Resistance:
26,000 (Psychological Level)
26,150 (Recent Swing High)
🔻 Immediate Support:
25,750
🔻 Structural Support:
25,600
Scenario 1: Bullish Breakout Continuation
A strong H1 candle close above 26,050 could trigger continuation momentum.
Upside Targets:
➡️ 26,200
➡️ 26,350
A breakout followed by a clean retest of 26,000 as support would offer higher-probability confirmation.
Scenario 2: Bearish Rejection
If price fails to sustain above 26,000–26,050 and prints rejection wicks or bearish confirmation,
a corrective pullback may follow.
Downside Targets:
➡️ 25,750
➡️ 25,600
Lower-high confirmation on M15 would strengthen the rejection case.
Market Note
NASDAQ is highly volatile during impulsive phases. Entering directly into resistance without
confirmation increases risk exposure significantly.
Disciplined execution and controlled position sizing remain essential.
Current Bias: Short-Term Bullish (Caution at 26,000 Resistance)
The reaction around 26,000 will likely determine the next 150–300 point directional move.
#NASDAQ #US100 #IndexTrading #MarketStructure #ForexAnalysis #TechnicalAnalysis #MustProfitFX
Disclaimer: This content is for educational purposes only. Trading involves significant risk.

JINDALSTEEL | Flag continuationStrong prior impulse, orderly flag structure
-RSI >50, EMAs rising, OBV confirms accumulation
-Sector tailwind: strength in metals
Trade plan:
-Buy > 1100 (volume confirmation required)
-SL: 1030
-Positional target: 1770
-R:R ≈ 1:11

NSE: EMCURE - Ready for take off?EMCURE is trading near its resistance in Daily/Weekly Timeframe. Last candle shows clear absorption of sellers near the resistance zone. If it comfortably closes above 1600, then it might give a big move. Wait for the confirmation before making a move.
This is not an Investment advice.

Intraday Institutiona TradingWhat Is an Option?
An option is a derivative contract whose value is derived from an underlying asset such as a stock, index, commodity, or currency.
Each option contract gives:
The buyer the right (not obligation)
The seller (writer) the obligation
to transact the underlying asset at a fixed price (strike price) on or before a specified date (expiry).
Key Types of Options
Call Option
Put Option

IBEX ltd analysisJAN-2025
1. has got good move and then time correction.
2. Volume is contracting.
3. good momentum score, Good durabilty score.
2. quaterly profit & revenue has increased.
3. EPS has increased.
4. Debt has gone down.has low debt
5. No change in institution holding.
i am managing my risk by stop loss of 6.6%

Part 2 Candle Stick PatternOption Buyer vs Option Seller
Option Buyer
Pays premium upfront
Has limited loss (premium)
Unlimited or large profit potential
Suffers from time decay
Option Seller (Writer)
Receives premium upfront
Limited profit (premium received)
Potentially unlimited loss (especially naked calls)
Benefits from time decay

Kitex (W): Aggressive Bullish, Political Catalyst + Tech Rev(Timeframe: Weekly | Scale: Logarithmic)
The stock has staged a V-Shape Reversal from a fresh 52-week low, forming a textbook Bullish Hammer on the weekly chart. This technical move is powered by a major political development (joining NDA), which removes significant "Political Risk" from the stock valuation.
🚀 1. The Fundamental Catalyst (The "Why")
The technical bounce is driven by a sentiment shift:
> Political Alignment (NDA Entry): The market expects that joining the ruling alliance will fast-track the company’s massive expansion plans in Telangana and reduce friction in its home state of Kerala.
> Valuation Comfort: At ₹138 (the low), the stock was trading at attractive valuations, prompting value buying in the textile sector which is seeing a revival.
📈 2. The Chart Structure (The Bear Trap)
> The Support: ₹147 the support.
- Refinement: The price momentarily broke this support to hit ₹138.20 (on Jan 21), triggering stop-losses, before skyrocketing back up. This indicates a "Bear Trap" or "Spring" formation, where smart money buys the panic selling.
> The Pattern: The Weekly Hammer has a very long lower shadow, indicating that sellers pushed price down, but buyers overwhelmed them to close the week near the high.
📊 3. Volume & Indicators
> Volume Spike: The 12.43 Million volume is an "Ignition Bar." It is significantly higher than the 10-week average.
> RSI: RSI reversing from the "Oversold" zone (below 30 on daily, rising on weekly) is a classic momentum divergence signal.
🎯 4. Future Scenarios & Key Levels
The stock has cleared the "Panic Bottom."
🐂 Bullish Targets (The Recovery):
- Target 1: ₹200. .
- Target 2: ₹295 - ₹298.
- Blue Sky: If the political tailwinds persist, a breakout above ₹324 (ATH) is possible in the long term.
🛡️ Support (The "Line in the Sand"):
- Immediate Support: ₹147 – ₹150. The previous support level is now reclaimed.
- Stop Loss: A close below ₹135 (below the Hammer's wick) would invalidate the reversal.
Conclusion
This is a High-Conviction Turnaround.
> Refinement: The "Hammer" is valid, but the Fundamental News (NDA) is what makes this a sustainable trend rather than a dead-cat bounce.
> Strategy: The reversal is confirmed. Use dips to accumulate.

MY ANALYSIS ON HDFC LIFE IN THE UPCOMING TRADING SESSIONS.On the weekly time frame, ₹750 can be clearly identified as a key support level. The stock attempted to hold this level on two earlier occasions but failed. On the third attempt, it decisively broke below ₹750.
Following this breakdown, the stock retested the ₹750 level on the weekly chart and then exhibited trend continuation, moving upward toward the ₹800–₹820 zone. However, this ₹800–₹820 range has now emerged as a strong resistance area. In particular, ₹820 is a critical level where the stock has repeatedly failed to sustain a breakout.
Additionally, the weekly chart shows the formation of a falling wedge pattern, developing within a well-defined channel. This channel represents a tight zone of price compression, suggesting that a decisive move is likely in the near term.
Shifting focus to the daily time frame, the lower trend line had been acting as a strong support. Each time the price touched this trend line, a pullback was observed. However, in the previous trading session, this lower trend line was decisively broken. Along with this breakdown, the ₹750 level—an important technical support—was also breached.
The breakdown of the lower trend line has resulted in a continuation of the downward move in HDFC Life.
From a technical perspective, the ₹720–₹730 zone now becomes a crucial level. If the stock manages to sustain above this range, it may be considered a stop-loss zone. Failure to hold this level could lead to further downside, with the next target expected around ₹680 and ₹650.

Part 1 Candle Stick Pattern Call Options Explained
A Call Option gives the buyer the right to buy the underlying asset at a specified strike price before or at expiry.
Example:
Stock price: ₹100
Call strike price: ₹105
Expiry: 1 month
Premium paid: ₹3
If the stock rises to ₹115:
Intrinsic value = ₹10
Profit = ₹10 − ₹3 = ₹7
If the stock stays below ₹105:
Option expires worthless
Maximum loss = premium paid (₹3)
Use Cases:
Bullish market view
Leverage with limited downside
Substitute for stock ownership

Crypto Altseason UpdateIt is going to come after btc completes its macro target 74k but till then alts gonna bleed hard. be careful in alts.

Formation of new waveJKL has completed the correction. Now This is the starting of new WAVE stopcoss just below the swing low. TGT minimum 1:3
